Zip Codes with the Highest Percentage of Self-Employed / Incorporated in North Dakota
RELATED REPORTS & OPTIONS
Self-Employed / Incorporated
North Dakota
Compare Zip Codes
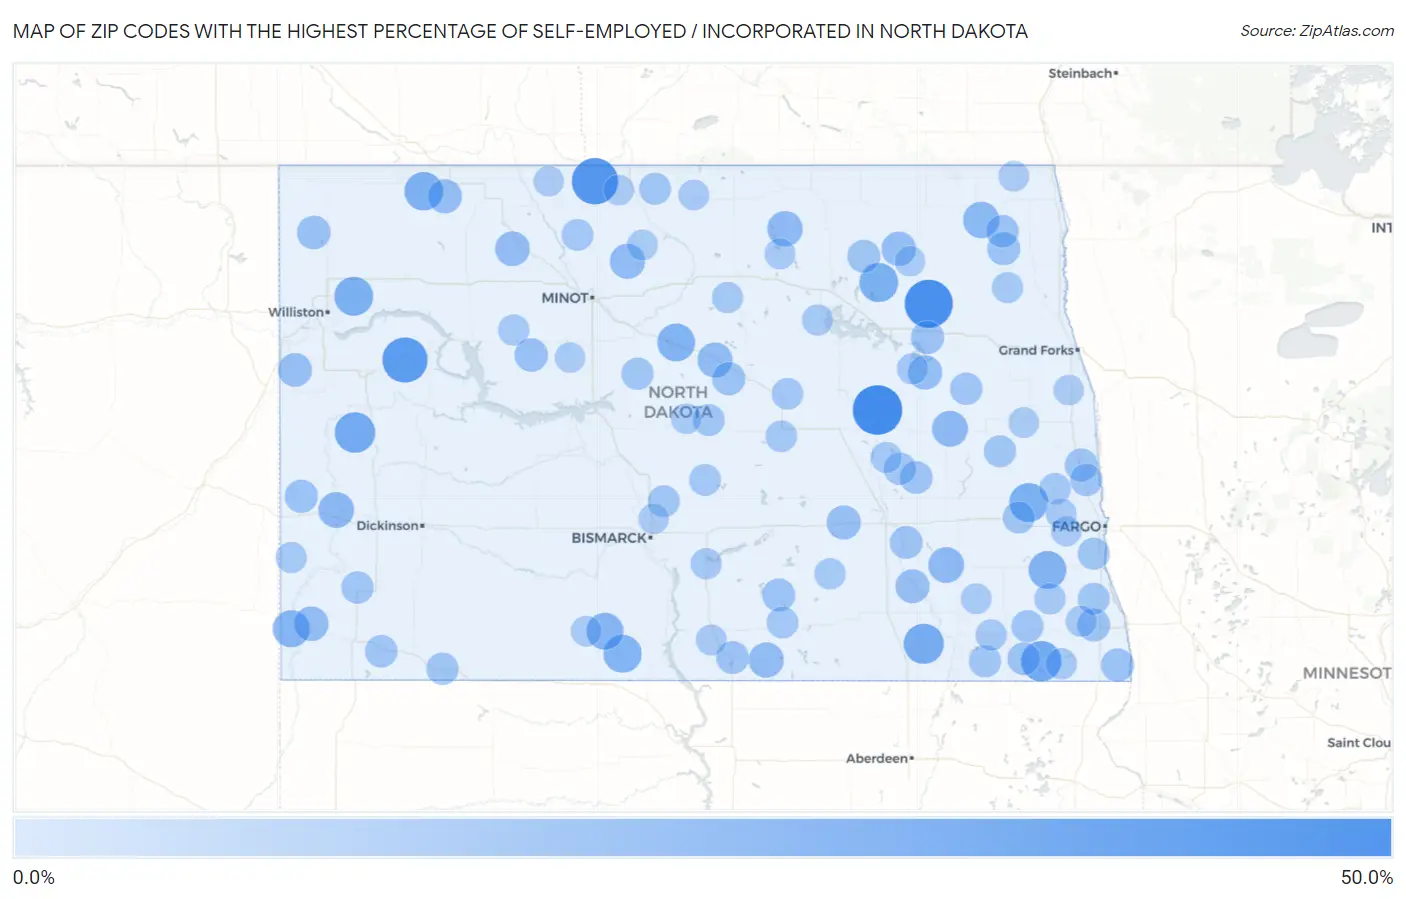
Map of Zip Codes with the Highest Percentage of Self-Employed / Incorporated in North Dakota
0.0%
50.0%
Zip Codes with the Highest Percentage of Self-Employed / Incorporated in North Dakota
| Zip Code | % Self-Employed / Incorporated | vs State | vs National | |
| 1. | 58445 | 40.7% | 3.5%(+37.2)#1 | 3.8%(+36.9)#127 |
| 2. | 58321 | 38.0% | 3.5%(+34.5)#2 | 3.8%(+34.2)#142 |
| 3. | 58711 | 34.8% | 3.5%(+31.3)#3 | 3.8%(+31.0)#164 |
| 4. | 58847 | 32.7% | 3.5%(+29.2)#4 | 3.8%(+28.9)#187 |
| 5. | 58634 | 24.1% | 3.5%(+20.6)#5 | 3.8%(+20.3)#335 |
| 6. | 58013 | 23.9% | 3.5%(+20.4)#6 | 3.8%(+20.1)#343 |
| 7. | 58441 | 23.5% | 3.5%(+20.0)#7 | 3.8%(+19.7)#354 |
| 8. | 58007 | 21.2% | 3.5%(+17.8)#8 | 3.8%(+17.4)#438 |
| 9. | 58843 | 21.1% | 3.5%(+17.6)#9 | 3.8%(+17.3)#440 |
| 10. | 58382 | 21.0% | 3.5%(+17.5)#10 | 3.8%(+17.2)#451 |
| 11. | 58727 | 20.8% | 3.5%(+17.3)#11 | 3.8%(+16.9)#466 |
| 12. | 58568 | 19.5% | 3.5%(+16.0)#12 | 3.8%(+15.7)#528 |
| 13. | 58052 | 19.1% | 3.5%(+15.6)#13 | 3.8%(+15.3)#555 |
| 14. | 58712 | 19.0% | 3.5%(+15.5)#14 | 3.8%(+15.2)#557 |
| 15. | 58643 | 17.9% | 3.5%(+14.4)#15 | 3.8%(+14.0)#636 |
| 16. | 58569 | 17.6% | 3.5%(+14.1)#16 | 3.8%(+13.8)#654 |
| 17. | 58262 | 16.7% | 3.5%(+13.2)#17 | 3.8%(+12.8)#742 |
| 18. | 58425 | 15.7% | 3.5%(+12.2)#18 | 3.8%(+11.9)#858 |
| 19. | 58461 | 15.7% | 3.5%(+12.2)#19 | 3.8%(+11.8)#863 |
| 20. | 58645 | 15.4% | 3.5%(+11.9)#20 | 3.8%(+11.6)#894 |
| 21. | 58353 | 15.0% | 3.5%(+11.5)#21 | 3.8%(+11.2)#955 |
| 22. | 58581 | 14.6% | 3.5%(+11.1)#22 | 3.8%(+10.8)#1,017 |
| 23. | 58731 | 14.4% | 3.5%(+10.9)#23 | 3.8%(+10.6)#1,048 |
| 24. | 58710 | 14.2% | 3.5%(+10.7)#24 | 3.8%(+10.4)#1,098 |
| 25. | 58734 | 13.6% | 3.5%(+10.1)#25 | 3.8%(+9.74)#1,223 |
| 26. | 58651 | 13.4% | 3.5%(+9.86)#26 | 3.8%(+9.54)#1,254 |
| 27. | 58338 | 13.2% | 3.5%(+9.66)#27 | 3.8%(+9.34)#1,288 |
| 28. | 58361 | 12.8% | 3.5%(+9.34)#28 | 3.8%(+9.03)#1,346 |
| 29. | 58752 | 12.7% | 3.5%(+9.16)#29 | 3.8%(+8.84)#1,403 |
| 30. | 58424 | 12.6% | 3.5%(+9.05)#30 | 3.8%(+8.74)#1,429 |
| 31. | 58431 | 12.2% | 3.5%(+8.75)#31 | 3.8%(+8.43)#1,508 |
| 32. | 58838 | 12.1% | 3.5%(+8.60)#32 | 3.8%(+8.28)#1,547 |
| 33. | 58856 | 11.8% | 3.5%(+8.26)#33 | 3.8%(+7.95)#1,630 |
| 34. | 58779 | 11.4% | 3.5%(+7.88)#34 | 3.8%(+7.56)#1,753 |
| 35. | 58621 | 11.1% | 3.5%(+7.57)#35 | 3.8%(+7.26)#1,859 |
| 36. | 58758 | 11.0% | 3.5%(+7.51)#36 | 3.8%(+7.19)#1,897 |
| 37. | 58030 | 11.0% | 3.5%(+7.49)#37 | 3.8%(+7.17)#1,905 |
| 38. | 58344 | 11.0% | 3.5%(+7.47)#38 | 3.8%(+7.15)#1,912 |
| 39. | 58561 | 10.7% | 3.5%(+7.20)#39 | 3.8%(+6.88)#2,017 |
| 40. | 58243 | 10.7% | 3.5%(+7.20)#40 | 3.8%(+6.88)#2,018 |
| 41. | 58038 | 10.5% | 3.5%(+7.03)#41 | 3.8%(+6.71)#2,090 |
| 42. | 58061 | 10.5% | 3.5%(+6.99)#42 | 3.8%(+6.68)#2,101 |
| 43. | 58497 | 10.5% | 3.5%(+6.98)#43 | 3.8%(+6.66)#2,108 |
| 44. | 58377 | 10.4% | 3.5%(+6.94)#44 | 3.8%(+6.62)#2,118 |
| 45. | 58542 | 10.4% | 3.5%(+6.89)#45 | 3.8%(+6.57)#2,138 |
| 46. | 58067 | 10.2% | 3.5%(+6.69)#46 | 3.8%(+6.37)#2,226 |
| 47. | 58222 | 10.1% | 3.5%(+6.60)#47 | 3.8%(+6.28)#2,265 |
| 48. | 58492 | 10.0% | 3.5%(+6.55)#48 | 3.8%(+6.23)#2,293 |
| 49. | 58036 | 9.6% | 3.5%(+6.07)#49 | 3.8%(+5.75)#2,556 |
| 50. | 58653 | 9.6% | 3.5%(+6.06)#50 | 3.8%(+5.74)#2,560 |
| 51. | 58426 | 9.5% | 3.5%(+6.02)#51 | 3.8%(+5.71)#2,577 |
| 52. | 58620 | 9.5% | 3.5%(+5.96)#52 | 3.8%(+5.64)#2,611 |
| 53. | 58212 | 9.4% | 3.5%(+5.94)#53 | 3.8%(+5.63)#2,620 |
| 54. | 58017 | 9.3% | 3.5%(+5.79)#54 | 3.8%(+5.47)#2,701 |
| 55. | 58639 | 9.2% | 3.5%(+5.70)#55 | 3.8%(+5.38)#2,756 |
| 56. | 58060 | 9.2% | 3.5%(+5.70)#56 | 3.8%(+5.38)#2,758 |
| 57. | 58778 | 9.1% | 3.5%(+5.59)#57 | 3.8%(+5.27)#2,831 |
| 58. | 58046 | 9.1% | 3.5%(+5.56)#58 | 3.8%(+5.24)#2,846 |
| 59. | 58783 | 8.9% | 3.5%(+5.44)#59 | 3.8%(+5.12)#2,917 |
| 60. | 58047 | 8.7% | 3.5%(+5.25)#60 | 3.8%(+4.93)#3,045 |
| 61. | 58430 | 8.7% | 3.5%(+5.20)#61 | 3.8%(+4.88)#3,086 |
| 62. | 58011 | 8.6% | 3.5%(+5.12)#62 | 3.8%(+4.80)#3,132 |
| 63. | 58521 | 8.6% | 3.5%(+5.10)#63 | 3.8%(+4.79)#3,146 |
| 64. | 58018 | 8.5% | 3.5%(+5.00)#64 | 3.8%(+4.68)#3,228 |
| 65. | 58750 | 8.5% | 3.5%(+4.96)#65 | 3.8%(+4.64)#3,266 |
| 66. | 58494 | 8.4% | 3.5%(+4.92)#66 | 3.8%(+4.60)#3,304 |
| 67. | 58495 | 8.3% | 3.5%(+4.78)#67 | 3.8%(+4.46)#3,421 |
| 68. | 58438 | 8.1% | 3.5%(+4.57)#68 | 3.8%(+4.25)#3,608 |
| 69. | 58418 | 8.1% | 3.5%(+4.56)#69 | 3.8%(+4.25)#3,614 |
| 70. | 58006 | 7.9% | 3.5%(+4.37)#70 | 3.8%(+4.05)#3,784 |
| 71. | 58053 | 7.8% | 3.5%(+4.26)#71 | 3.8%(+3.94)#3,904 |
| 72. | 58057 | 7.8% | 3.5%(+4.26)#72 | 3.8%(+3.94)#3,905 |
| 73. | 58040 | 7.7% | 3.5%(+4.23)#73 | 3.8%(+3.92)#3,931 |
| 74. | 58771 | 7.6% | 3.5%(+4.08)#74 | 3.8%(+3.77)#4,083 |
| 75. | 58380 | 7.5% | 3.5%(+4.05)#75 | 3.8%(+3.73)#4,115 |
| 76. | 58368 | 7.5% | 3.5%(+4.02)#76 | 3.8%(+3.71)#4,145 |
| 77. | 58442 | 7.3% | 3.5%(+3.84)#77 | 3.8%(+3.53)#4,341 |
| 78. | 58008 | 7.3% | 3.5%(+3.82)#78 | 3.8%(+3.50)#4,380 |
| 79. | 58273 | 7.3% | 3.5%(+3.77)#79 | 3.8%(+3.46)#4,430 |
| 80. | 58455 | 7.2% | 3.5%(+3.72)#80 | 3.8%(+3.41)#4,488 |
| 81. | 58560 | 7.2% | 3.5%(+3.69)#81 | 3.8%(+3.38)#4,523 |
| 82. | 58632 | 7.2% | 3.5%(+3.69)#82 | 3.8%(+3.37)#4,528 |
| 83. | 58351 | 7.2% | 3.5%(+3.68)#83 | 3.8%(+3.36)#4,540 |
| 84. | 58789 | 6.9% | 3.5%(+3.44)#84 | 3.8%(+3.12)#4,848 |
| 85. | 58385 | 6.9% | 3.5%(+3.40)#85 | 3.8%(+3.08)#4,903 |
| 86. | 58033 | 6.9% | 3.5%(+3.38)#86 | 3.8%(+3.07)#4,915 |
| 87. | 58552 | 6.8% | 3.5%(+3.27)#87 | 3.8%(+2.96)#5,067 |
| 88. | 58318 | 6.6% | 3.5%(+3.07)#88 | 3.8%(+2.75)#5,399 |
| 89. | 58012 | 6.6% | 3.5%(+3.06)#89 | 3.8%(+2.74)#5,416 |
| 90. | 58564 | 6.5% | 3.5%(+3.02)#90 | 3.8%(+2.70)#5,455 |
| 91. | 58463 | 6.4% | 3.5%(+2.90)#91 | 3.8%(+2.58)#5,634 |
| 92. | 58274 | 6.4% | 3.5%(+2.87)#92 | 3.8%(+2.56)#5,674 |
| 93. | 58265 | 6.4% | 3.5%(+2.86)#93 | 3.8%(+2.54)#5,705 |
| 94. | 58793 | 6.3% | 3.5%(+2.80)#94 | 3.8%(+2.48)#5,797 |
| 95. | 58503 | 6.3% | 3.5%(+2.76)#95 | 3.8%(+2.44)#5,871 |
| 96. | 58735 | 6.2% | 3.5%(+2.72)#96 | 3.8%(+2.40)#5,943 |
| 97. | 58275 | 6.2% | 3.5%(+2.67)#97 | 3.8%(+2.35)#6,025 |
| 98. | 58059 | 6.2% | 3.5%(+2.65)#98 | 3.8%(+2.33)#6,058 |
| 99. | 58782 | 6.1% | 3.5%(+2.62)#99 | 3.8%(+2.31)#6,112 |
| 100. | 58330 | 6.0% | 3.5%(+2.53)#100 | 3.8%(+2.22)#6,262 |
Common Questions
What are the Top 10 Zip Codes with the Highest Percentage of Self-Employed / Incorporated in North Dakota?
Top 10 Zip Codes with the Highest Percentage of Self-Employed / Incorporated in North Dakota are:
What zip code has the Highest Percentage of Self-Employed / Incorporated in North Dakota?
58445 has the Highest Percentage of Self-Employed / Incorporated in North Dakota with 40.7%.
What is the Percentage of Self-Employed / Incorporated in the State of North Dakota?
Percentage of Self-Employed / Incorporated in North Dakota is 3.5%.
What is the Percentage of Self-Employed / Incorporated in the United States?
Percentage of Self-Employed / Incorporated in the United States is 3.8%.