Zip Codes with the Highest Percentage of Population Employed in Transportation & Warehousing in North Dakota
RELATED REPORTS & OPTIONS
Transportation & Warehousing
North Dakota
Compare Zip Codes
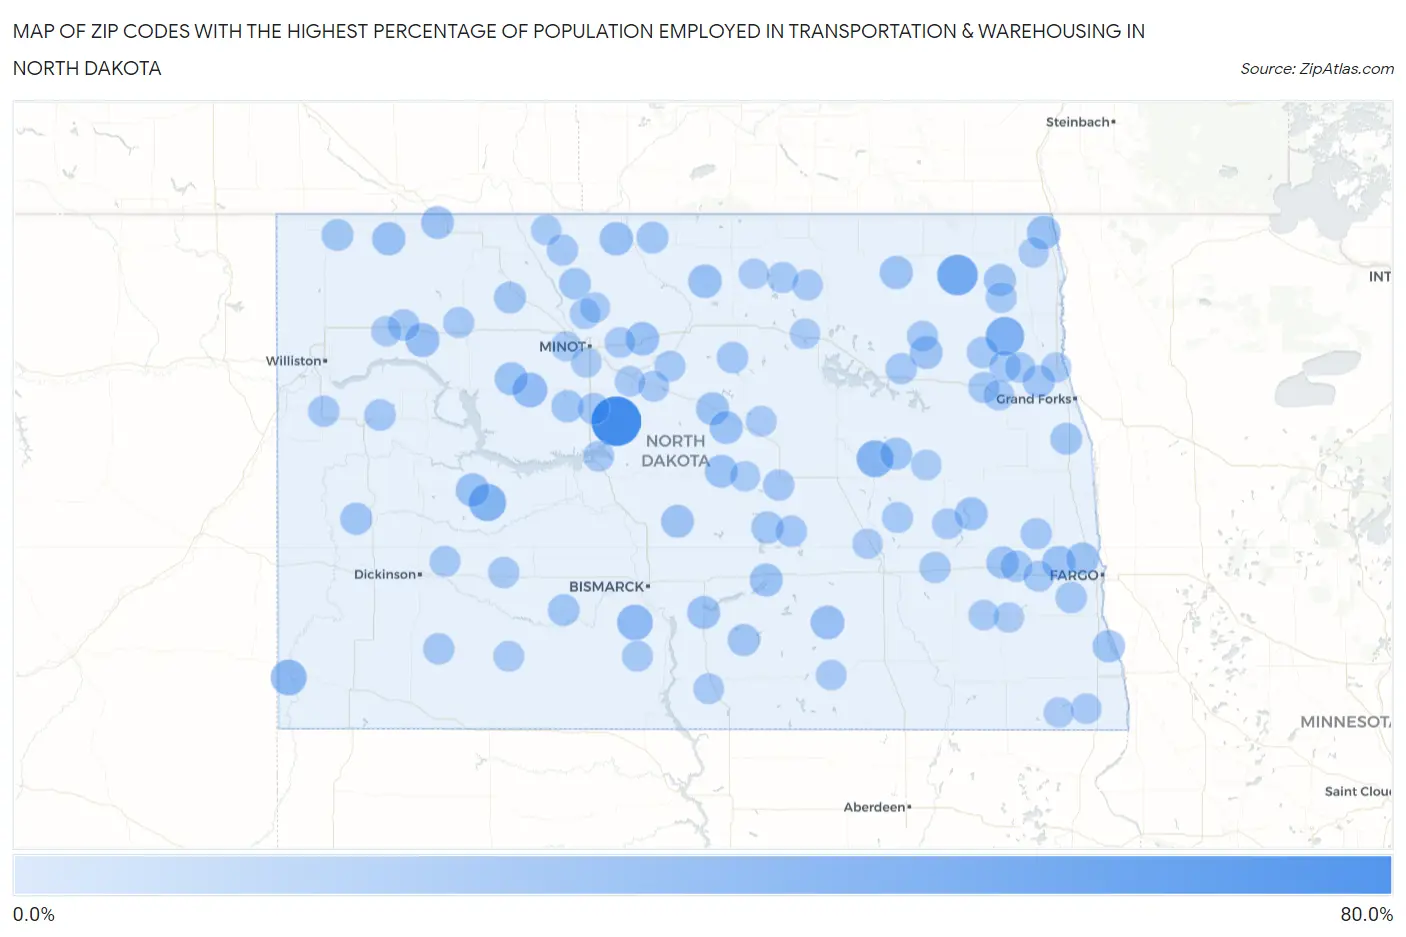
Map of Zip Codes with the Highest Percentage of Population Employed in Transportation & Warehousing in North Dakota
0.0%
80.0%
Zip Codes with the Highest Percentage of Population Employed in Transportation & Warehousing in North Dakota
| Zip Code | % Employed | vs State | vs National | |
| 1. | 58716 | 61.5% | 4.1%(+57.4)#1 | 4.9%(+56.5)#49 |
| 2. | 58260 | 35.0% | 4.1%(+30.9)#2 | 4.9%(+30.1)#166 |
| 3. | 58273 | 29.1% | 4.1%(+25.0)#3 | 4.9%(+24.1)#247 |
| 4. | 58625 | 25.6% | 4.1%(+21.5)#4 | 4.9%(+20.7)#319 |
| 5. | 58445 | 24.4% | 4.1%(+20.3)#5 | 4.9%(+19.5)#348 |
| 6. | 58643 | 21.4% | 4.1%(+17.3)#6 | 4.9%(+16.5)#458 |
| 7. | 58566 | 21.0% | 4.1%(+16.9)#7 | 4.9%(+16.0)#479 |
| 8. | 58756 | 18.6% | 4.1%(+14.5)#8 | 4.9%(+13.6)#632 |
| 9. | 58794 | 16.5% | 4.1%(+12.4)#9 | 4.9%(+11.6)#847 |
| 10. | 58442 | 15.8% | 4.1%(+11.7)#10 | 4.9%(+10.8)#944 |
| 11. | 58384 | 15.4% | 4.1%(+11.3)#11 | 4.9%(+10.4)#993 |
| 12. | 58271 | 15.2% | 4.1%(+11.1)#12 | 4.9%(+10.2)#1,023 |
| 13. | 58636 | 15.2% | 4.1%(+11.1)#13 | 4.9%(+10.2)#1,025 |
| 14. | 58793 | 15.1% | 4.1%(+11.0)#14 | 4.9%(+10.2)#1,038 |
| 15. | 58741 | 15.1% | 4.1%(+11.0)#15 | 4.9%(+10.1)#1,042 |
| 16. | 58765 | 14.4% | 4.1%(+10.3)#16 | 4.9%(+9.48)#1,176 |
| 17. | 58311 | 14.3% | 4.1%(+10.2)#17 | 4.9%(+9.34)#1,217 |
| 18. | 58771 | 14.2% | 4.1%(+10.1)#18 | 4.9%(+9.21)#1,249 |
| 19. | 58012 | 14.0% | 4.1%(+9.88)#19 | 4.9%(+9.03)#1,291 |
| 20. | 58710 | 13.8% | 4.1%(+9.70)#20 | 4.9%(+8.85)#1,323 |
| 21. | 58758 | 13.8% | 4.1%(+9.66)#21 | 4.9%(+8.82)#1,330 |
| 22. | 58428 | 13.7% | 4.1%(+9.58)#22 | 4.9%(+8.73)#1,353 |
| 23. | 58560 | 13.7% | 4.1%(+9.57)#23 | 4.9%(+8.72)#1,356 |
| 24. | 58444 | 13.4% | 4.1%(+9.34)#24 | 4.9%(+8.49)#1,415 |
| 25. | 58056 | 13.3% | 4.1%(+9.24)#25 | 4.9%(+8.39)#1,446 |
| 26. | 58772 | 13.3% | 4.1%(+9.16)#26 | 4.9%(+8.31)#1,467 |
| 27. | 58321 | 13.2% | 4.1%(+9.11)#27 | 4.9%(+8.26)#1,481 |
| 28. | 58477 | 13.2% | 4.1%(+9.06)#28 | 4.9%(+8.21)#1,494 |
| 29. | 58042 | 12.5% | 4.1%(+8.44)#29 | 4.9%(+7.59)#1,666 |
| 30. | 58071 | 12.0% | 4.1%(+7.87)#30 | 4.9%(+7.02)#1,879 |
| 31. | 58001 | 12.0% | 4.1%(+7.87)#31 | 4.9%(+7.02)#1,881 |
| 32. | 58258 | 11.9% | 4.1%(+7.78)#32 | 4.9%(+6.93)#1,912 |
| 33. | 58627 | 11.8% | 4.1%(+7.67)#33 | 4.9%(+6.82)#1,970 |
| 34. | 58478 | 11.7% | 4.1%(+7.57)#34 | 4.9%(+6.72)#2,002 |
| 35. | 58735 | 11.4% | 4.1%(+7.30)#35 | 4.9%(+6.45)#2,123 |
| 36. | 58549 | 11.3% | 4.1%(+7.25)#36 | 4.9%(+6.40)#2,151 |
| 37. | 58222 | 11.2% | 4.1%(+7.12)#37 | 4.9%(+6.27)#2,224 |
| 38. | 58464 | 11.1% | 4.1%(+7.01)#38 | 4.9%(+6.16)#2,271 |
| 39. | 58734 | 11.0% | 4.1%(+6.92)#39 | 4.9%(+6.07)#2,316 |
| 40. | 58783 | 10.6% | 4.1%(+6.54)#40 | 4.9%(+5.69)#2,507 |
| 41. | 58275 | 10.5% | 4.1%(+6.36)#41 | 4.9%(+5.51)#2,610 |
| 42. | 58833 | 10.4% | 4.1%(+6.35)#42 | 4.9%(+5.50)#2,614 |
| 43. | 58750 | 10.2% | 4.1%(+6.12)#43 | 4.9%(+5.27)#2,750 |
| 44. | 58520 | 10.1% | 4.1%(+6.03)#44 | 4.9%(+5.18)#2,801 |
| 45. | 58852 | 10.0% | 4.1%(+5.89)#45 | 4.9%(+5.04)#2,902 |
| 46. | 58011 | 9.9% | 4.1%(+5.77)#46 | 4.9%(+4.92)#2,972 |
| 47. | 58854 | 9.8% | 4.1%(+5.70)#47 | 4.9%(+4.85)#3,013 |
| 48. | 58759 | 9.7% | 4.1%(+5.58)#48 | 4.9%(+4.73)#3,094 |
| 49. | 58313 | 9.5% | 4.1%(+5.43)#49 | 4.9%(+4.58)#3,219 |
| 50. | 58475 | 9.4% | 4.1%(+5.34)#50 | 4.9%(+4.49)#3,285 |
| 51. | 58021 | 9.4% | 4.1%(+5.32)#51 | 4.9%(+4.47)#3,305 |
| 52. | 58231 | 9.2% | 4.1%(+5.13)#52 | 4.9%(+4.28)#3,459 |
| 53. | 58029 | 9.1% | 4.1%(+4.99)#53 | 4.9%(+4.14)#3,611 |
| 54. | 58244 | 9.1% | 4.1%(+4.99)#54 | 4.9%(+4.14)#3,614 |
| 55. | 58831 | 9.1% | 4.1%(+4.98)#55 | 4.9%(+4.13)#3,627 |
| 56. | 58418 | 9.0% | 4.1%(+4.95)#56 | 4.9%(+4.10)#3,662 |
| 57. | 58650 | 9.0% | 4.1%(+4.90)#57 | 4.9%(+4.05)#3,703 |
| 58. | 58327 | 9.0% | 4.1%(+4.90)#58 | 4.9%(+4.05)#3,704 |
| 59. | 58761 | 8.9% | 4.1%(+4.83)#59 | 4.9%(+3.98)#3,784 |
| 60. | 58480 | 8.9% | 4.1%(+4.79)#60 | 4.9%(+3.94)#3,827 |
| 61. | 58638 | 8.9% | 4.1%(+4.75)#61 | 4.9%(+3.91)#3,869 |
| 62. | 58266 | 8.4% | 4.1%(+4.34)#62 | 4.9%(+3.49)#4,347 |
| 63. | 58353 | 8.3% | 4.1%(+4.24)#63 | 4.9%(+3.39)#4,478 |
| 64. | 58243 | 8.2% | 4.1%(+4.13)#64 | 4.9%(+3.28)#4,603 |
| 65. | 58345 | 8.2% | 4.1%(+4.07)#65 | 4.9%(+3.22)#4,682 |
| 66. | 58630 | 7.9% | 4.1%(+3.85)#66 | 4.9%(+3.00)#4,969 |
| 67. | 58426 | 7.9% | 4.1%(+3.84)#67 | 4.9%(+2.99)#4,984 |
| 68. | 58784 | 7.9% | 4.1%(+3.82)#68 | 4.9%(+2.97)#5,008 |
| 69. | 58744 | 7.9% | 4.1%(+3.80)#69 | 4.9%(+2.95)#5,039 |
| 70. | 58570 | 7.9% | 4.1%(+3.77)#70 | 4.9%(+2.92)#5,079 |
| 71. | 58079 | 7.8% | 4.1%(+3.75)#71 | 4.9%(+2.90)#5,120 |
| 72. | 58768 | 7.7% | 4.1%(+3.64)#72 | 4.9%(+2.79)#5,267 |
| 73. | 58562 | 7.7% | 4.1%(+3.64)#73 | 4.9%(+2.79)#5,268 |
| 74. | 58531 | 7.7% | 4.1%(+3.60)#74 | 4.9%(+2.75)#5,333 |
| 75. | 58429 | 7.7% | 4.1%(+3.60)#75 | 4.9%(+2.75)#5,338 |
| 76. | 58792 | 7.7% | 4.1%(+3.60)#76 | 4.9%(+2.75)#5,339 |
| 77. | 58341 | 7.6% | 4.1%(+3.54)#77 | 4.9%(+2.69)#5,409 |
| 78. | 58552 | 7.5% | 4.1%(+3.44)#78 | 4.9%(+2.59)#5,581 |
| 79. | 58317 | 7.5% | 4.1%(+3.37)#79 | 4.9%(+2.52)#5,718 |
| 80. | 58251 | 7.5% | 4.1%(+3.36)#80 | 4.9%(+2.51)#5,720 |
| 81. | 58704 | 7.2% | 4.1%(+3.14)#81 | 4.9%(+2.29)#6,130 |
| 82. | 58041 | 7.2% | 4.1%(+3.07)#82 | 4.9%(+2.22)#6,244 |
| 83. | 58790 | 7.0% | 4.1%(+2.90)#83 | 4.9%(+2.05)#6,567 |
| 84. | 58440 | 7.0% | 4.1%(+2.88)#84 | 4.9%(+2.03)#6,609 |
| 85. | 58235 | 6.8% | 4.1%(+2.72)#85 | 4.9%(+1.87)#6,930 |
| 86. | 58062 | 6.8% | 4.1%(+2.66)#86 | 4.9%(+1.81)#7,048 |
| 87. | 58053 | 6.7% | 4.1%(+2.57)#87 | 4.9%(+1.72)#7,230 |
| 88. | 58027 | 6.6% | 4.1%(+2.50)#88 | 4.9%(+1.65)#7,380 |
| 89. | 58346 | 6.5% | 4.1%(+2.45)#89 | 4.9%(+1.60)#7,476 |
| 90. | 58740 | 6.5% | 4.1%(+2.45)#90 | 4.9%(+1.60)#7,479 |
| 91. | 58416 | 6.5% | 4.1%(+2.44)#91 | 4.9%(+1.59)#7,496 |
| 92. | 58366 | 6.5% | 4.1%(+2.39)#92 | 4.9%(+1.54)#7,602 |
| 93. | 58451 | 6.4% | 4.1%(+2.29)#93 | 4.9%(+1.44)#7,850 |
| 94. | 58849 | 6.4% | 4.1%(+2.28)#94 | 4.9%(+1.43)#7,856 |
| 95. | 58238 | 6.2% | 4.1%(+2.15)#95 | 4.9%(+1.30)#8,178 |
| 96. | 58722 | 6.2% | 4.1%(+2.11)#96 | 4.9%(+1.26)#8,261 |
| 97. | 58701 | 6.2% | 4.1%(+2.09)#97 | 4.9%(+1.24)#8,323 |
| 98. | 58420 | 6.2% | 4.1%(+2.07)#98 | 4.9%(+1.22)#8,362 |
| 99. | 58256 | 6.1% | 4.1%(+2.05)#99 | 4.9%(+1.20)#8,415 |
| 100. | 58782 | 6.1% | 4.1%(+2.03)#100 | 4.9%(+1.18)#8,477 |
Common Questions
What are the Top 10 Zip Codes with the Highest Percentage of Population Employed in Transportation & Warehousing in North Dakota?
Top 10 Zip Codes with the Highest Percentage of Population Employed in Transportation & Warehousing in North Dakota are:
What zip code has the Highest Percentage of Population Employed in Transportation & Warehousing in North Dakota?
58716 has the Highest Percentage of Population Employed in Transportation & Warehousing in North Dakota with 61.5%.
What is the Percentage of Population Employed in Transportation & Warehousing in the State of North Dakota?
Percentage of Population Employed in Transportation & Warehousing in North Dakota is 4.1%.
What is the Percentage of Population Employed in Transportation & Warehousing in the United States?
Percentage of Population Employed in Transportation & Warehousing in the United States is 4.9%.