Zip Codes with the Highest Percentage of Population Employed in Arts, Entertainment & Recreation in North Dakota
RELATED REPORTS & OPTIONS
Arts, Entertainment & Recreation
North Dakota
Compare Zip Codes
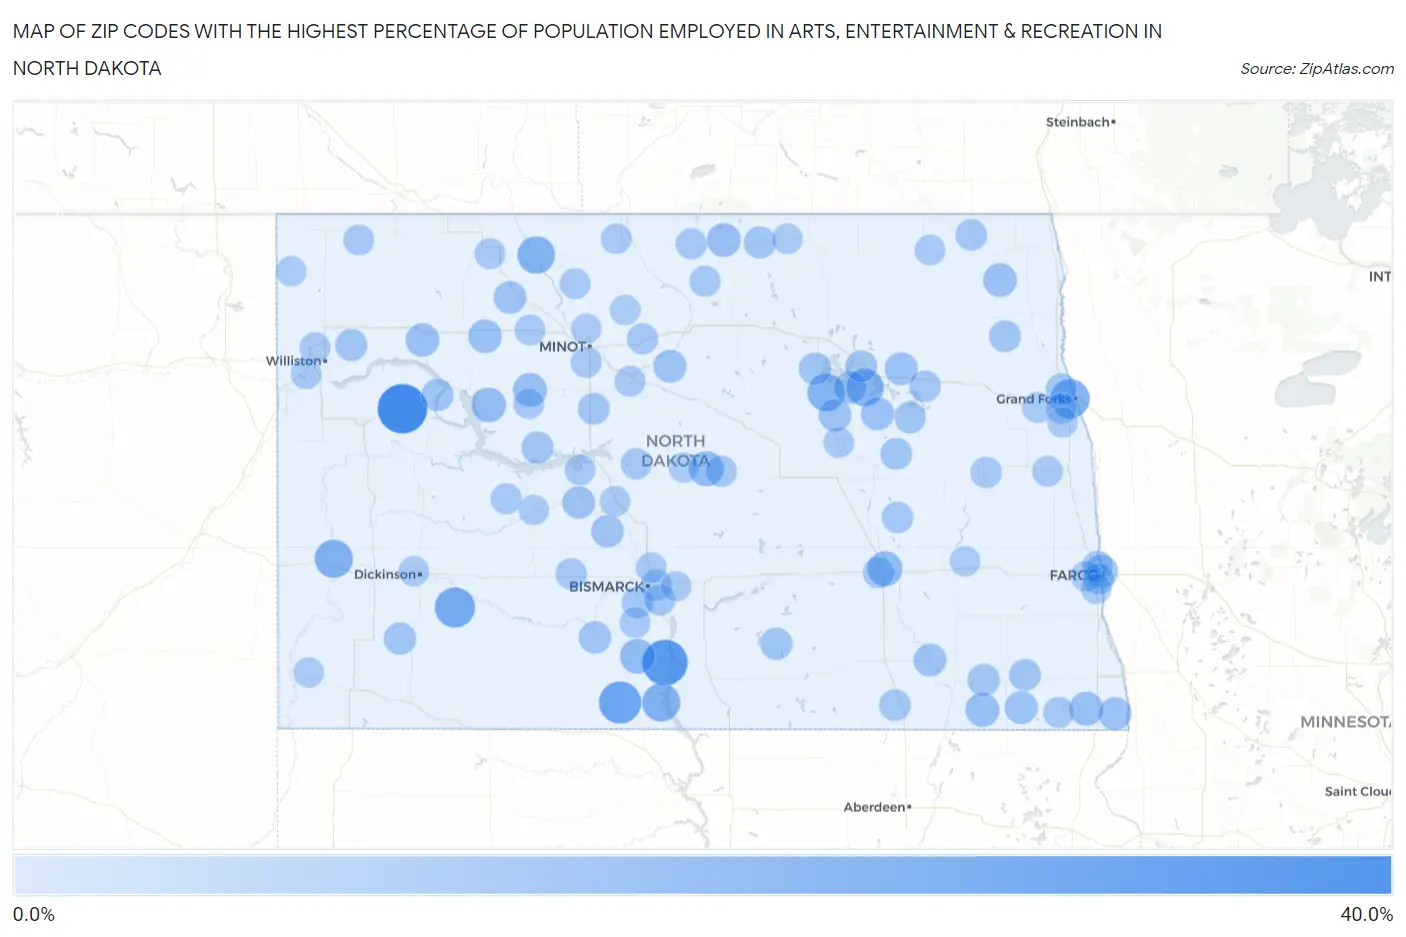
Map of Zip Codes with the Highest Percentage of Population Employed in Arts, Entertainment & Recreation in North Dakota
0.0%
40.0%
Zip Codes with the Highest Percentage of Population Employed in Arts, Entertainment & Recreation in North Dakota
| Zip Code | % Employed | vs State | vs National | |
| 1. | 58847 | 32.7% | 2.0%(+30.7)#1 | 2.1%(+30.6)#67 |
| 2. | 58528 | 25.7% | 2.0%(+23.7)#2 | 2.1%(+23.6)#110 |
| 3. | 58568 | 20.2% | 2.0%(+18.2)#3 | 2.1%(+18.1)#179 |
| 4. | 58641 | 17.2% | 2.0%(+15.2)#4 | 2.1%(+15.2)#250 |
| 5. | 58202 | 15.7% | 2.0%(+13.7)#5 | 2.1%(+13.6)#306 |
| 6. | 58538 | 13.9% | 2.0%(+11.9)#6 | 2.1%(+11.8)#399 |
| 7. | 58645 | 13.8% | 2.0%(+11.8)#7 | 2.1%(+11.7)#401 |
| 8. | 58357 | 13.0% | 2.0%(+10.9)#8 | 2.1%(+10.9)#452 |
| 9. | 58787 | 12.9% | 2.0%(+10.9)#9 | 2.1%(+10.8)#458 |
| 10. | 58370 | 12.9% | 2.0%(+10.8)#10 | 2.1%(+10.8)#461 |
| 11. | 58570 | 8.8% | 2.0%(+6.79)#11 | 2.1%(+6.71)#891 |
| 12. | 58405 | 8.7% | 2.0%(+6.72)#12 | 2.1%(+6.64)#904 |
| 13. | 58430 | 8.7% | 2.0%(+6.69)#13 | 2.1%(+6.61)#911 |
| 14. | 58770 | 7.9% | 2.0%(+5.91)#14 | 2.1%(+5.83)#1,085 |
| 15. | 58041 | 7.2% | 2.0%(+5.16)#15 | 2.1%(+5.08)#1,280 |
| 16. | 58756 | 7.1% | 2.0%(+5.14)#16 | 2.1%(+5.06)#1,290 |
| 17. | 58329 | 7.0% | 2.0%(+4.96)#17 | 2.1%(+4.88)#1,347 |
| 18. | 58017 | 6.9% | 2.0%(+4.89)#18 | 2.1%(+4.81)#1,364 |
| 19. | 58222 | 6.5% | 2.0%(+4.54)#19 | 2.1%(+4.46)#1,474 |
| 20. | 58769 | 6.5% | 2.0%(+4.45)#20 | 2.1%(+4.37)#1,521 |
| 21. | 58794 | 6.4% | 2.0%(+4.42)#21 | 2.1%(+4.34)#1,532 |
| 22. | 58105 | 6.3% | 2.0%(+4.29)#22 | 2.1%(+4.21)#1,588 |
| 23. | 58381 | 5.8% | 2.0%(+3.83)#23 | 2.1%(+3.75)#1,785 |
| 24. | 58030 | 5.6% | 2.0%(+3.57)#24 | 2.1%(+3.49)#1,920 |
| 25. | 58067 | 5.6% | 2.0%(+3.55)#25 | 2.1%(+3.47)#1,937 |
| 26. | 58327 | 5.5% | 2.0%(+3.50)#26 | 2.1%(+3.42)#1,963 |
| 27. | 58458 | 5.3% | 2.0%(+3.28)#27 | 2.1%(+3.20)#2,090 |
| 28. | 58744 | 5.3% | 2.0%(+3.26)#28 | 2.1%(+3.18)#2,107 |
| 29. | 58374 | 5.1% | 2.0%(+3.08)#29 | 2.1%(+3.00)#2,224 |
| 30. | 58734 | 5.1% | 2.0%(+3.08)#30 | 2.1%(+3.00)#2,227 |
| 31. | 58335 | 5.0% | 2.0%(+3.00)#31 | 2.1%(+2.92)#2,284 |
| 32. | 58571 | 5.0% | 2.0%(+2.95)#32 | 2.1%(+2.87)#2,321 |
| 33. | 58530 | 4.8% | 2.0%(+2.77)#33 | 2.1%(+2.69)#2,462 |
| 34. | 58647 | 4.7% | 2.0%(+2.73)#34 | 2.1%(+2.65)#2,504 |
| 35. | 58535 | 4.7% | 2.0%(+2.65)#35 | 2.1%(+2.57)#2,578 |
| 36. | 58351 | 4.6% | 2.0%(+2.61)#36 | 2.1%(+2.53)#2,613 |
| 37. | 58763 | 4.5% | 2.0%(+2.53)#37 | 2.1%(+2.45)#2,692 |
| 38. | 58561 | 4.5% | 2.0%(+2.52)#38 | 2.1%(+2.44)#2,709 |
| 39. | 58069 | 4.4% | 2.0%(+2.41)#39 | 2.1%(+2.33)#2,834 |
| 40. | 58316 | 4.3% | 2.0%(+2.34)#40 | 2.1%(+2.26)#2,915 |
| 41. | 58843 | 4.1% | 2.0%(+2.13)#41 | 2.1%(+2.05)#3,168 |
| 42. | 58540 | 4.1% | 2.0%(+2.08)#42 | 2.1%(+2.00)#3,222 |
| 43. | 58464 | 3.7% | 2.0%(+1.70)#43 | 2.1%(+1.62)#3,772 |
| 44. | 58060 | 3.7% | 2.0%(+1.65)#44 | 2.1%(+1.57)#3,846 |
| 45. | 58380 | 3.6% | 2.0%(+1.63)#45 | 2.1%(+1.55)#3,882 |
| 46. | 58273 | 3.6% | 2.0%(+1.63)#46 | 2.1%(+1.55)#3,884 |
| 47. | 58759 | 3.5% | 2.0%(+1.54)#47 | 2.1%(+1.47)#4,034 |
| 48. | 58301 | 3.5% | 2.0%(+1.51)#48 | 2.1%(+1.43)#4,092 |
| 49. | 58436 | 3.4% | 2.0%(+1.44)#49 | 2.1%(+1.36)#4,262 |
| 50. | 58426 | 3.2% | 2.0%(+1.17)#50 | 2.1%(+1.09)#4,871 |
| 51. | 58344 | 3.1% | 2.0%(+1.13)#51 | 2.1%(+1.05)#4,974 |
| 52. | 58401 | 3.1% | 2.0%(+1.09)#52 | 2.1%(+1.01)#5,094 |
| 53. | 58282 | 3.1% | 2.0%(+1.07)#53 | 2.1%(+0.994)#5,140 |
| 54. | 58501 | 3.0% | 2.0%(+1.04)#54 | 2.1%(+0.962)#5,233 |
| 55. | 58554 | 3.0% | 2.0%(+1.000)#55 | 2.1%(+0.921)#5,347 |
| 56. | 58444 | 3.0% | 2.0%(+0.981)#56 | 2.1%(+0.903)#5,400 |
| 57. | 58230 | 2.7% | 2.0%(+0.736)#57 | 2.1%(+0.657)#6,225 |
| 58. | 58741 | 2.7% | 2.0%(+0.692)#58 | 2.1%(+0.613)#6,380 |
| 59. | 58318 | 2.6% | 2.0%(+0.643)#59 | 2.1%(+0.564)#6,570 |
| 60. | 58563 | 2.6% | 2.0%(+0.635)#60 | 2.1%(+0.556)#6,612 |
| 61. | 58053 | 2.6% | 2.0%(+0.605)#61 | 2.1%(+0.526)#6,722 |
| 62. | 58575 | 2.6% | 2.0%(+0.585)#62 | 2.1%(+0.506)#6,804 |
| 63. | 58102 | 2.5% | 2.0%(+0.530)#63 | 2.1%(+0.451)#7,028 |
| 64. | 58103 | 2.5% | 2.0%(+0.522)#64 | 2.1%(+0.443)#7,067 |
| 65. | 58203 | 2.4% | 2.0%(+0.408)#65 | 2.1%(+0.329)#7,585 |
| 66. | 58384 | 2.4% | 2.0%(+0.363)#66 | 2.1%(+0.284)#7,804 |
| 67. | 58541 | 2.4% | 2.0%(+0.355)#67 | 2.1%(+0.276)#7,843 |
| 68. | 58504 | 2.3% | 2.0%(+0.285)#68 | 2.1%(+0.206)#8,182 |
| 69. | 58228 | 2.2% | 2.0%(+0.192)#69 | 2.1%(+0.113)#8,669 |
| 70. | 58750 | 2.2% | 2.0%(+0.147)#70 | 2.1%(+0.068)#8,921 |
| 71. | 58730 | 2.1% | 2.0%(+0.145)#71 | 2.1%(+0.066)#8,931 |
| 72. | 58701 | 2.1% | 2.0%(+0.130)#72 | 2.1%(+0.051)#9,026 |
| 73. | 58566 | 2.1% | 2.0%(+0.094)#73 | 2.1%(+0.015)#9,223 |
| 74. | 58565 | 2.1% | 2.0%(+0.080)#74 | 2.1%(+0.001)#9,313 |
| 75. | 58746 | 2.1% | 2.0%(+0.053)#75 | 2.1%(-0.026)#9,453 |
| 76. | 58718 | 2.1% | 2.0%(+0.048)#76 | 2.1%(-0.031)#9,489 |
| 77. | 58790 | 2.0% | 2.0%(+0.037)#77 | 2.1%(-0.042)#9,542 |
| 78. | 58078 | 2.0% | 2.0%(-0.008)#78 | 2.1%(-0.087)#9,806 |
| 79. | 58201 | 2.0% | 2.0%(-0.010)#79 | 2.1%(-0.089)#9,819 |
| 80. | 58257 | 2.0% | 2.0%(-0.041)#80 | 2.1%(-0.120)#10,004 |
| 81. | 58801 | 1.9% | 2.0%(-0.064)#81 | 2.1%(-0.142)#10,137 |
| 82. | 58356 | 1.9% | 2.0%(-0.087)#82 | 2.1%(-0.166)#10,290 |
| 83. | 58853 | 1.9% | 2.0%(-0.138)#83 | 2.1%(-0.217)#10,581 |
| 84. | 58793 | 1.8% | 2.0%(-0.205)#84 | 2.1%(-0.284)#11,025 |
| 85. | 58779 | 1.8% | 2.0%(-0.228)#85 | 2.1%(-0.307)#11,199 |
| 86. | 58503 | 1.7% | 2.0%(-0.295)#86 | 2.1%(-0.374)#11,678 |
| 87. | 58367 | 1.7% | 2.0%(-0.352)#87 | 2.1%(-0.431)#12,069 |
| 88. | 58845 | 1.6% | 2.0%(-0.406)#88 | 2.1%(-0.485)#12,480 |
| 89. | 58249 | 1.6% | 2.0%(-0.407)#89 | 2.1%(-0.486)#12,488 |
| 90. | 58601 | 1.6% | 2.0%(-0.435)#90 | 2.1%(-0.514)#12,721 |
| 91. | 58651 | 1.5% | 2.0%(-0.477)#91 | 2.1%(-0.556)#13,056 |
| 92. | 58731 | 1.5% | 2.0%(-0.526)#92 | 2.1%(-0.605)#13,393 |
| 93. | 58577 | 1.4% | 2.0%(-0.574)#93 | 2.1%(-0.653)#13,750 |
| 94. | 58558 | 1.4% | 2.0%(-0.652)#94 | 2.1%(-0.731)#14,350 |
| 95. | 58463 | 1.3% | 2.0%(-0.657)#95 | 2.1%(-0.736)#14,392 |
| 96. | 58104 | 1.3% | 2.0%(-0.658)#96 | 2.1%(-0.737)#14,397 |
| 97. | 58703 | 1.3% | 2.0%(-0.662)#97 | 2.1%(-0.741)#14,433 |
| 98. | 58072 | 1.3% | 2.0%(-0.668)#98 | 2.1%(-0.747)#14,472 |
| 99. | 58523 | 1.3% | 2.0%(-0.695)#99 | 2.1%(-0.774)#14,655 |
| 100. | 58278 | 1.3% | 2.0%(-0.724)#100 | 2.1%(-0.803)#14,868 |
Common Questions
What are the Top 10 Zip Codes with the Highest Percentage of Population Employed in Arts, Entertainment & Recreation in North Dakota?
Top 10 Zip Codes with the Highest Percentage of Population Employed in Arts, Entertainment & Recreation in North Dakota are:
What zip code has the Highest Percentage of Population Employed in Arts, Entertainment & Recreation in North Dakota?
58847 has the Highest Percentage of Population Employed in Arts, Entertainment & Recreation in North Dakota with 32.7%.
What is the Percentage of Population Employed in Arts, Entertainment & Recreation in the State of North Dakota?
Percentage of Population Employed in Arts, Entertainment & Recreation in North Dakota is 2.0%.
What is the Percentage of Population Employed in Arts, Entertainment & Recreation in the United States?
Percentage of Population Employed in Arts, Entertainment & Recreation in the United States is 2.1%.