Zip Codes with the Highest Percentage of Population Employed in Agriculture, Fishing & Hunting in Grand Forks, ND
RELATED REPORTS & OPTIONS
Agriculture, Fishing & Hunting
Grand Forks
Compare Zip Codes
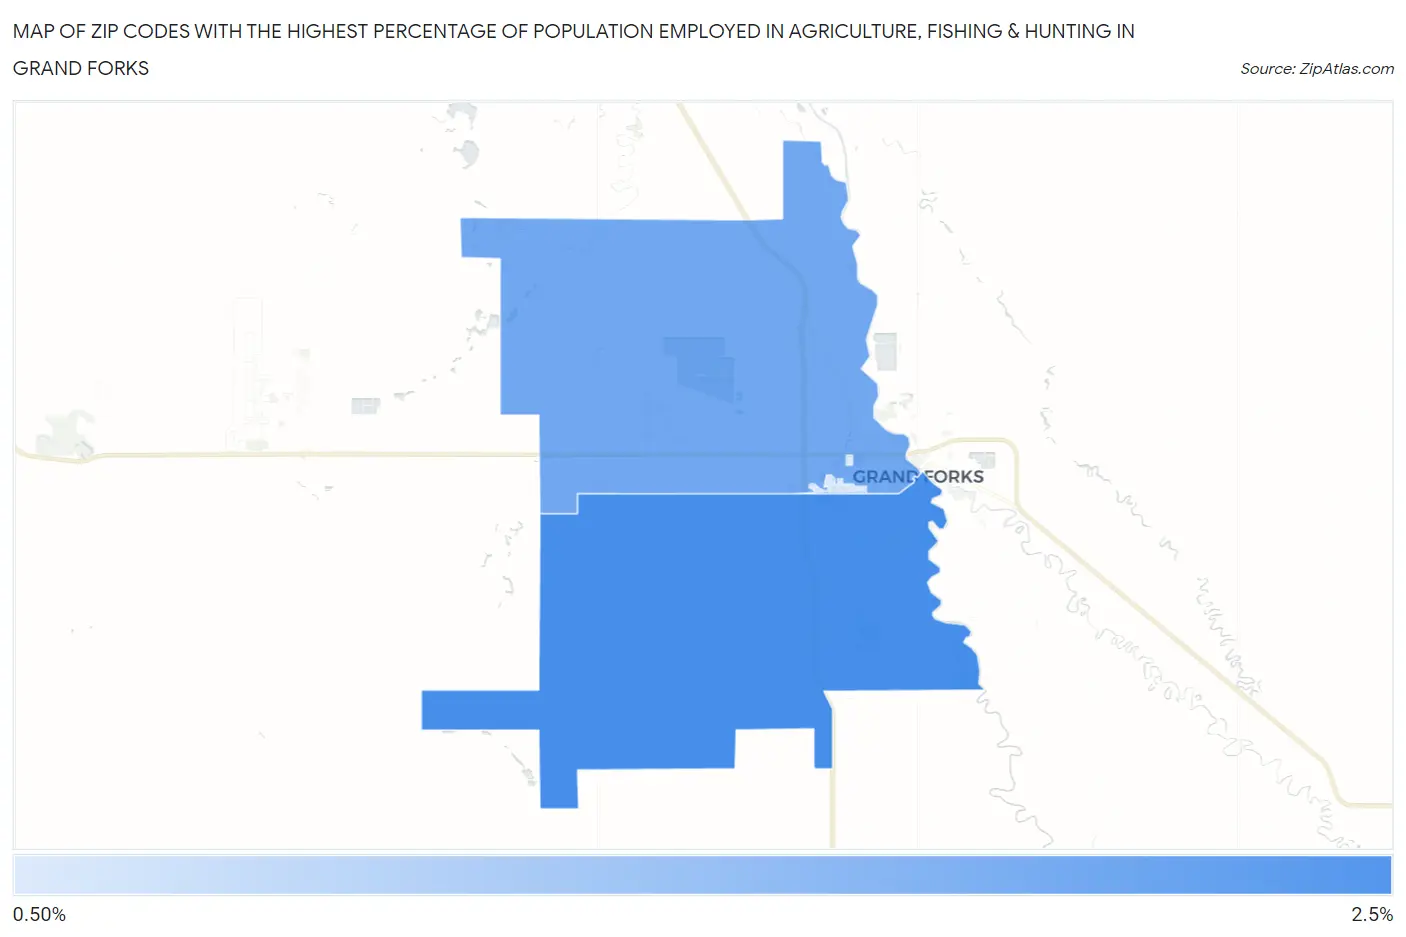
Map of Zip Codes with the Highest Percentage of Population Employed in Agriculture, Fishing & Hunting in Grand Forks
0.0%
2.5%
Zip Codes with the Highest Percentage of Population Employed in Agriculture, Fishing & Hunting in Grand Forks, ND
| Zip Code | % Employed | vs State | vs National | |
| 1. | 58201 | 2.3% | 5.6%(-3.34)#337 | 1.2%(+1.07)#12,076 |
| 2. | 58203 | 1.9% | 5.6%(-3.74)#342 | 1.2%(+0.679)#13,085 |
| 3. | 58202 | 0.82% | 5.6%(-4.79)#357 | 1.2%(-0.375)#17,111 |
1
Common Questions
What are the Top Zip Codes with the Highest Percentage of Population Employed in Agriculture, Fishing & Hunting in Grand Forks, ND?
Top Zip Codes with the Highest Percentage of Population Employed in Agriculture, Fishing & Hunting in Grand Forks, ND are:
What zip code has the Highest Percentage of Population Employed in Agriculture, Fishing & Hunting in Grand Forks, ND?
58201 has the Highest Percentage of Population Employed in Agriculture, Fishing & Hunting in Grand Forks, ND with 2.3%.
What is the Percentage of Population Employed in Agriculture, Fishing & Hunting in Grand Forks, ND?
Percentage of Population Employed in Agriculture, Fishing & Hunting in Grand Forks is 1.9%.
What is the Percentage of Population Employed in Agriculture, Fishing & Hunting in North Dakota?
Percentage of Population Employed in Agriculture, Fishing & Hunting in North Dakota is 5.6%.
What is the Percentage of Population Employed in Agriculture, Fishing & Hunting in the United States?
Percentage of Population Employed in Agriculture, Fishing & Hunting in the United States is 1.2%.