Zip Codes with the Highest Percentage of Population Employed in Farming, Fishing & Forestry in Grand Forks, ND
RELATED REPORTS & OPTIONS
Farming, Fishing & Forestry
Grand Forks
Compare Zip Codes
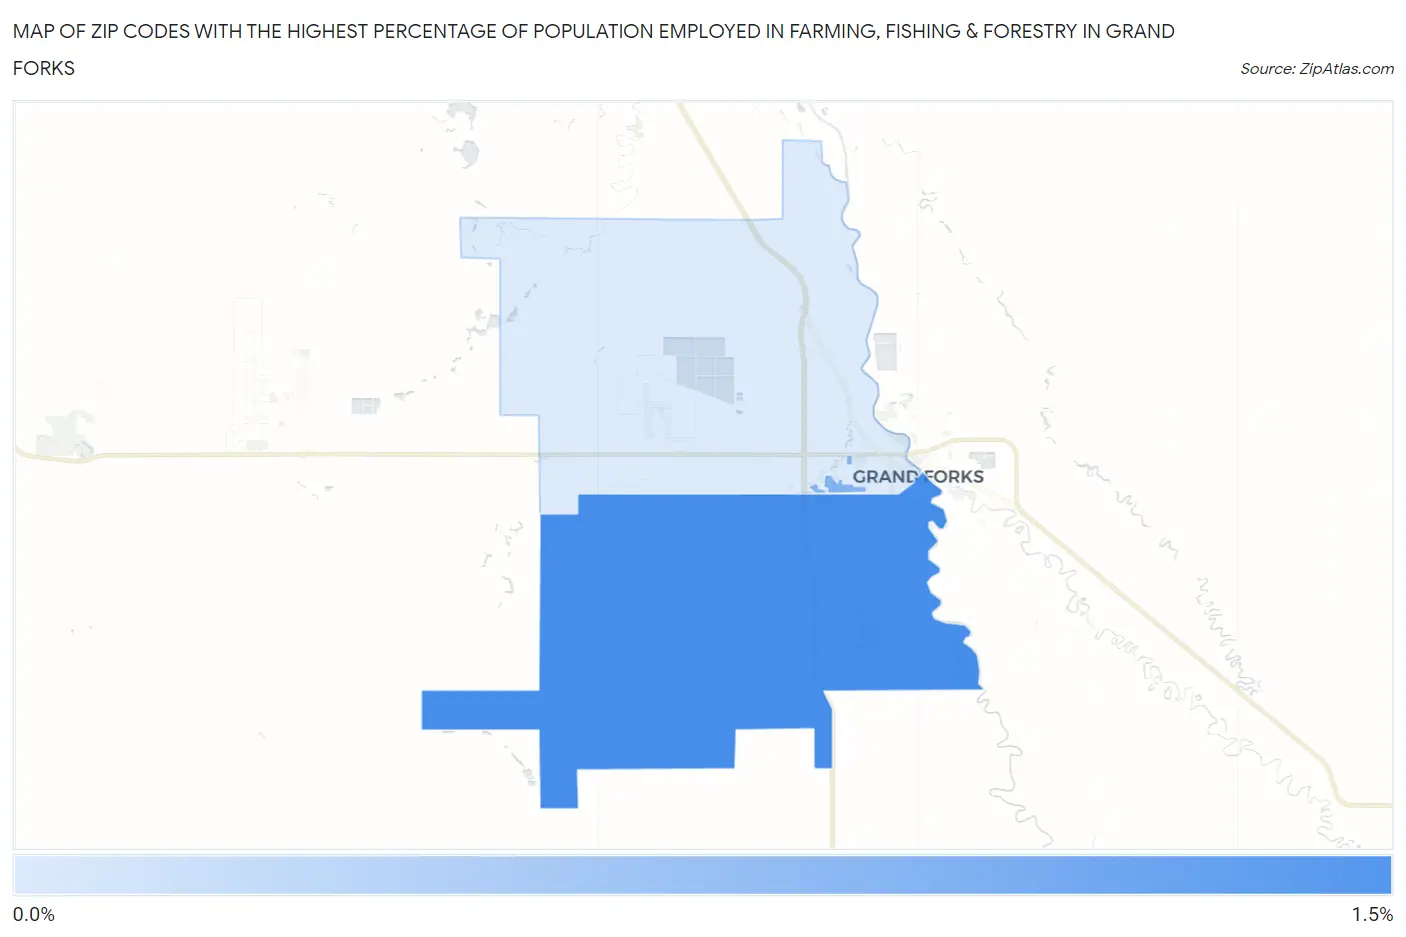
Map of Zip Codes with the Highest Percentage of Population Employed in Farming, Fishing & Forestry in Grand Forks
0.0%
1.5%
Zip Codes with the Highest Percentage of Population Employed in Farming, Fishing & Forestry in Grand Forks, ND
| Zip Code | % Employed | vs State | vs National | |
| 1. | 58201 | 1.0% | 1.6%(-0.541)#242 | 0.61%(+0.442)#9,530 |
| 2. | 58202 | 0.82% | 1.6%(-0.764)#258 | 0.61%(+0.219)#10,639 |
| 3. | 58203 | 0.49% | 1.6%(-1.10)#279 | 0.61%(-0.113)#12,907 |
1
Common Questions
What are the Top Zip Codes with the Highest Percentage of Population Employed in Farming, Fishing & Forestry in Grand Forks, ND?
Top Zip Codes with the Highest Percentage of Population Employed in Farming, Fishing & Forestry in Grand Forks, ND are:
What zip code has the Highest Percentage of Population Employed in Farming, Fishing & Forestry in Grand Forks, ND?
58201 has the Highest Percentage of Population Employed in Farming, Fishing & Forestry in Grand Forks, ND with 1.0%.
What is the Percentage of Population Employed in Farming, Fishing & Forestry in Grand Forks, ND?
Percentage of Population Employed in Farming, Fishing & Forestry in Grand Forks is 0.85%.
What is the Percentage of Population Employed in Farming, Fishing & Forestry in North Dakota?
Percentage of Population Employed in Farming, Fishing & Forestry in North Dakota is 1.6%.
What is the Percentage of Population Employed in Farming, Fishing & Forestry in the United States?
Percentage of Population Employed in Farming, Fishing & Forestry in the United States is 0.61%.