Zip Codes with the Highest Percentage of Population Employed in Transportation & Warehousing in North Carolina
RELATED REPORTS & OPTIONS
Transportation & Warehousing
North Carolina
Compare Zip Codes
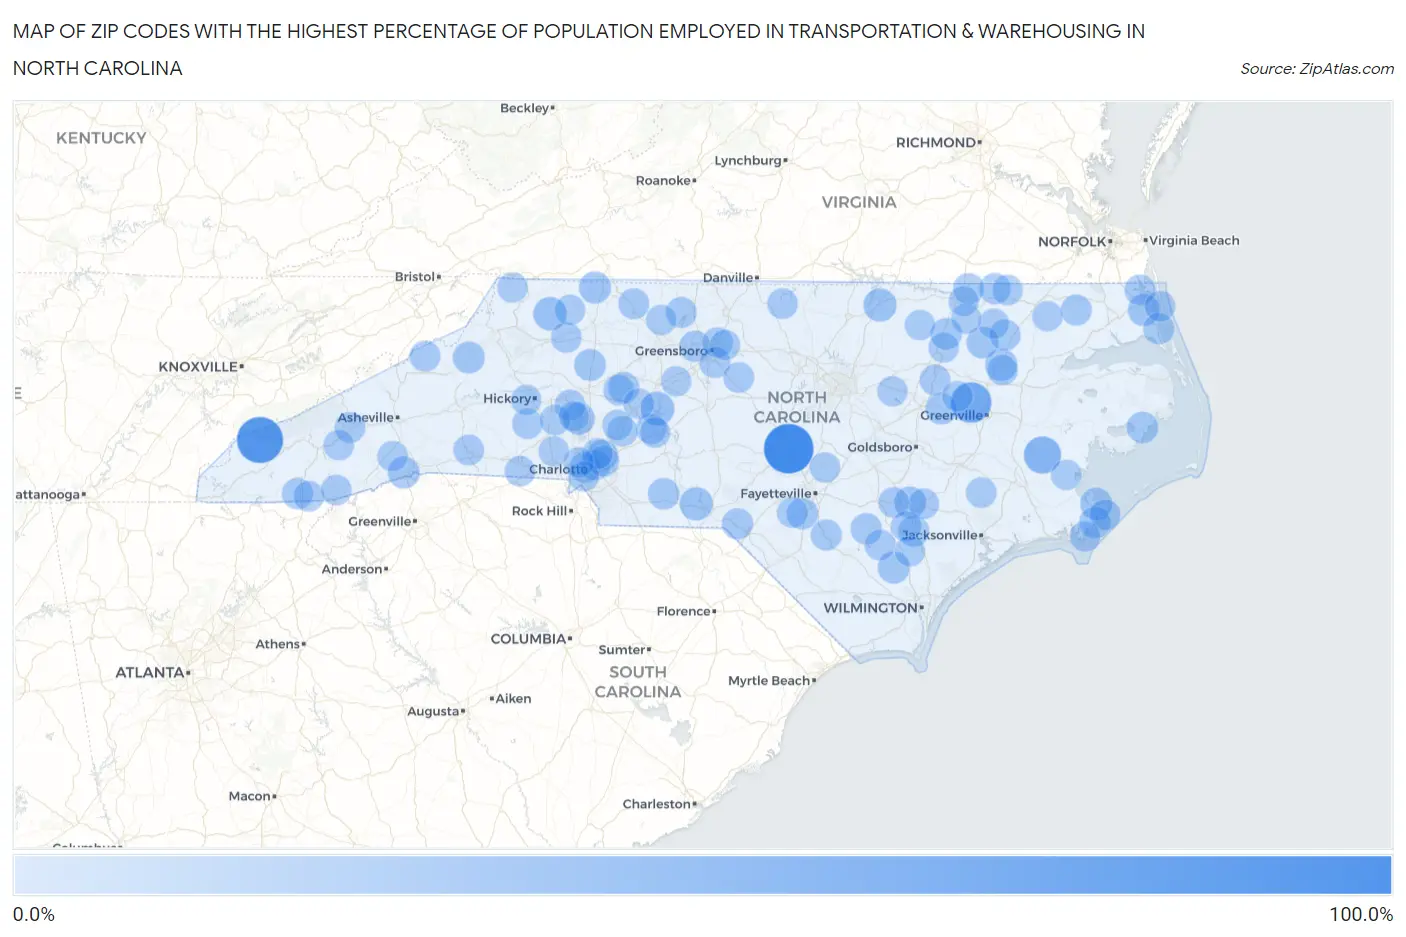
Map of Zip Codes with the Highest Percentage of Population Employed in Transportation & Warehousing in North Carolina
0.0%
100.0%
Zip Codes with the Highest Percentage of Population Employed in Transportation & Warehousing in North Carolina
| Zip Code | % Employed | vs State | vs National | |
| 1. | 28368 | 100.0% | 4.3%(+95.7)#1 | 4.9%(+95.1)#3 |
| 2. | 28733 | 82.6% | 4.3%(+78.3)#2 | 4.9%(+77.7)#29 |
| 3. | 27827 | 55.5% | 4.3%(+51.1)#3 | 4.9%(+50.5)#62 |
| 4. | 27821 | 40.0% | 4.3%(+35.7)#4 | 4.9%(+35.1)#128 |
| 5. | 27351 | 23.9% | 4.3%(+19.5)#5 | 4.9%(+18.9)#372 |
| 6. | 28649 | 22.1% | 4.3%(+17.7)#6 | 4.9%(+17.1)#436 |
| 7. | 28091 | 20.8% | 4.3%(+16.4)#7 | 4.9%(+15.8)#489 |
| 8. | 27556 | 20.5% | 4.3%(+16.2)#8 | 4.9%(+15.6)#507 |
| 9. | 28682 | 16.7% | 4.3%(+12.3)#9 | 4.9%(+11.7)#814 |
| 10. | 27857 | 16.6% | 4.3%(+12.3)#10 | 4.9%(+11.7)#832 |
| 11. | 27024 | 16.0% | 4.3%(+11.7)#11 | 4.9%(+11.1)#901 |
| 12. | 28520 | 16.0% | 4.3%(+11.7)#12 | 4.9%(+11.1)#909 |
| 13. | 27874 | 15.6% | 4.3%(+11.2)#13 | 4.9%(+10.6)#964 |
| 14. | 28421 | 15.4% | 4.3%(+11.0)#14 | 4.9%(+10.4)#999 |
| 15. | 28790 | 15.2% | 4.3%(+10.9)#15 | 4.9%(+10.3)#1,016 |
| 16. | 28398 | 15.2% | 4.3%(+10.9)#16 | 4.9%(+10.3)#1,019 |
| 17. | 28616 | 14.8% | 4.3%(+10.5)#17 | 4.9%(+9.87)#1,103 |
| 18. | 27917 | 14.5% | 4.3%(+10.2)#18 | 4.9%(+9.57)#1,163 |
| 19. | 28660 | 14.4% | 4.3%(+10.0)#19 | 4.9%(+9.41)#1,191 |
| 20. | 28135 | 13.5% | 4.3%(+9.16)#20 | 4.9%(+8.56)#1,388 |
| 21. | 27873 | 13.4% | 4.3%(+9.09)#21 | 4.9%(+8.49)#1,413 |
| 22. | 28581 | 13.2% | 4.3%(+8.89)#22 | 4.9%(+8.29)#1,472 |
| 23. | 28371 | 13.0% | 4.3%(+8.61)#23 | 4.9%(+8.01)#1,545 |
| 24. | 27824 | 12.9% | 4.3%(+8.57)#24 | 4.9%(+7.97)#1,559 |
| 25. | 27823 | 12.8% | 4.3%(+8.48)#25 | 4.9%(+7.88)#1,582 |
| 26. | 28351 | 12.1% | 4.3%(+7.80)#26 | 4.9%(+7.20)#1,802 |
| 27. | 28441 | 12.0% | 4.3%(+7.69)#27 | 4.9%(+7.09)#1,845 |
| 28. | 27853 | 11.9% | 4.3%(+7.60)#28 | 4.9%(+7.00)#1,889 |
| 29. | 27947 | 11.8% | 4.3%(+7.48)#29 | 4.9%(+6.88)#1,935 |
| 30. | 27014 | 11.5% | 4.3%(+7.19)#30 | 4.9%(+6.59)#2,055 |
| 31. | 27847 | 11.4% | 4.3%(+7.03)#31 | 4.9%(+6.43)#2,132 |
| 32. | 27409 | 11.2% | 4.3%(+6.85)#32 | 4.9%(+6.25)#2,232 |
| 33. | 28763 | 11.2% | 4.3%(+6.81)#33 | 4.9%(+6.21)#2,249 |
| 34. | 28262 | 11.0% | 4.3%(+6.65)#34 | 4.9%(+6.05)#2,328 |
| 35. | 28392 | 10.9% | 4.3%(+6.58)#35 | 4.9%(+5.98)#2,358 |
| 36. | 27866 | 10.8% | 4.3%(+6.44)#36 | 4.9%(+5.84)#2,430 |
| 37. | 28464 | 10.6% | 4.3%(+6.29)#37 | 4.9%(+5.69)#2,509 |
| 38. | 27042 | 10.6% | 4.3%(+6.27)#38 | 4.9%(+5.67)#2,520 |
| 39. | 28511 | 10.6% | 4.3%(+6.20)#39 | 4.9%(+5.60)#2,563 |
| 40. | 27946 | 10.5% | 4.3%(+6.17)#40 | 4.9%(+5.57)#2,580 |
| 41. | 27041 | 10.5% | 4.3%(+6.16)#41 | 4.9%(+5.56)#2,584 |
| 42. | 28357 | 10.4% | 4.3%(+6.02)#42 | 4.9%(+5.42)#2,662 |
| 43. | 28740 | 10.2% | 4.3%(+5.82)#43 | 4.9%(+5.22)#2,777 |
| 44. | 27054 | 10.1% | 4.3%(+5.74)#44 | 4.9%(+5.14)#2,838 |
| 45. | 27878 | 10.0% | 4.3%(+5.65)#45 | 4.9%(+5.05)#2,885 |
| 46. | 27406 | 9.9% | 4.3%(+5.54)#46 | 4.9%(+4.94)#2,962 |
| 47. | 28349 | 9.9% | 4.3%(+5.51)#47 | 4.9%(+4.90)#2,981 |
| 48. | 28444 | 9.8% | 4.3%(+5.50)#48 | 4.9%(+4.90)#2,991 |
| 49. | 28393 | 9.7% | 4.3%(+5.39)#49 | 4.9%(+4.79)#3,051 |
| 50. | 27950 | 9.7% | 4.3%(+5.35)#50 | 4.9%(+4.75)#3,073 |
| 51. | 27298 | 9.7% | 4.3%(+5.34)#51 | 4.9%(+4.74)#3,082 |
| 52. | 28208 | 9.6% | 4.3%(+5.27)#52 | 4.9%(+4.67)#3,156 |
| 53. | 28745 | 9.5% | 4.3%(+5.12)#53 | 4.9%(+4.52)#3,262 |
| 54. | 27291 | 9.4% | 4.3%(+5.08)#54 | 4.9%(+4.48)#3,291 |
| 55. | 28206 | 9.4% | 4.3%(+5.01)#55 | 4.9%(+4.41)#3,357 |
| 56. | 28160 | 9.3% | 4.3%(+4.96)#56 | 4.9%(+4.36)#3,385 |
| 57. | 28213 | 9.3% | 4.3%(+4.96)#57 | 4.9%(+4.36)#3,395 |
| 58. | 28609 | 9.1% | 4.3%(+4.80)#58 | 4.9%(+4.20)#3,533 |
| 59. | 28168 | 9.1% | 4.3%(+4.80)#59 | 4.9%(+4.19)#3,544 |
| 60. | 28775 | 9.1% | 4.3%(+4.79)#60 | 4.9%(+4.19)#3,558 |
| 61. | 27405 | 9.1% | 4.3%(+4.76)#61 | 4.9%(+4.16)#3,583 |
| 62. | 28659 | 9.1% | 4.3%(+4.72)#62 | 4.9%(+4.12)#3,631 |
| 63. | 28585 | 9.0% | 4.3%(+4.61)#63 | 4.9%(+4.01)#3,746 |
| 64. | 28717 | 8.9% | 4.3%(+4.60)#64 | 4.9%(+4.00)#3,761 |
| 65. | 28071 | 8.9% | 4.3%(+4.59)#65 | 4.9%(+3.99)#3,765 |
| 66. | 28073 | 8.9% | 4.3%(+4.59)#66 | 4.9%(+3.99)#3,773 |
| 67. | 28553 | 8.9% | 4.3%(+4.58)#67 | 4.9%(+3.98)#3,786 |
| 68. | 28109 | 8.9% | 4.3%(+4.55)#68 | 4.9%(+3.95)#3,805 |
| 69. | 28269 | 8.8% | 4.3%(+4.49)#69 | 4.9%(+3.89)#3,887 |
| 70. | 28707 | 8.8% | 4.3%(+4.46)#70 | 4.9%(+3.86)#3,919 |
| 71. | 27927 | 8.8% | 4.3%(+4.45)#71 | 4.9%(+3.85)#3,928 |
| 72. | 28729 | 8.7% | 4.3%(+4.35)#72 | 4.9%(+3.75)#4,058 |
| 73. | 27852 | 8.7% | 4.3%(+4.33)#73 | 4.9%(+3.73)#4,071 |
| 74. | 27840 | 8.6% | 4.3%(+4.23)#74 | 4.9%(+3.63)#4,189 |
| 75. | 27891 | 8.5% | 4.3%(+4.19)#75 | 4.9%(+3.59)#4,237 |
| 76. | 28650 | 8.5% | 4.3%(+4.18)#76 | 4.9%(+3.58)#4,241 |
| 77. | 27922 | 8.5% | 4.3%(+4.14)#77 | 4.9%(+3.54)#4,286 |
| 78. | 27862 | 8.5% | 4.3%(+4.10)#78 | 4.9%(+3.50)#4,329 |
| 79. | 27869 | 8.4% | 4.3%(+4.02)#79 | 4.9%(+3.42)#4,420 |
| 80. | 28083 | 8.3% | 4.3%(+4.00)#80 | 4.9%(+3.40)#4,450 |
| 81. | 28458 | 8.3% | 4.3%(+3.99)#81 | 4.9%(+3.39)#4,453 |
| 82. | 28587 | 8.3% | 4.3%(+3.99)#82 | 4.9%(+3.39)#4,473 |
| 83. | 28685 | 8.3% | 4.3%(+3.94)#83 | 4.9%(+3.34)#4,528 |
| 84. | 28159 | 8.3% | 4.3%(+3.91)#84 | 4.9%(+3.31)#4,576 |
| 85. | 28637 | 8.2% | 4.3%(+3.89)#85 | 4.9%(+3.29)#4,601 |
| 86. | 28356 | 8.2% | 4.3%(+3.87)#86 | 4.9%(+3.27)#4,621 |
| 87. | 27557 | 8.1% | 4.3%(+3.80)#87 | 4.9%(+3.20)#4,704 |
| 88. | 28088 | 8.1% | 4.3%(+3.76)#88 | 4.9%(+3.16)#4,739 |
| 89. | 28217 | 8.1% | 4.3%(+3.73)#89 | 4.9%(+3.13)#4,792 |
| 90. | 27019 | 8.0% | 4.3%(+3.68)#90 | 4.9%(+3.08)#4,860 |
| 91. | 27844 | 8.0% | 4.3%(+3.64)#91 | 4.9%(+3.04)#4,913 |
| 92. | 28478 | 7.9% | 4.3%(+3.57)#92 | 4.9%(+2.97)#5,011 |
| 93. | 28643 | 7.9% | 4.3%(+3.57)#93 | 4.9%(+2.97)#5,012 |
| 94. | 27839 | 7.9% | 4.3%(+3.55)#94 | 4.9%(+2.95)#5,033 |
| 95. | 27360 | 7.9% | 4.3%(+3.55)#95 | 4.9%(+2.95)#5,043 |
| 96. | 28214 | 7.8% | 4.3%(+3.48)#96 | 4.9%(+2.88)#5,147 |
| 97. | 28673 | 7.8% | 4.3%(+3.46)#97 | 4.9%(+2.86)#5,170 |
| 98. | 27831 | 7.8% | 4.3%(+3.45)#98 | 4.9%(+2.85)#5,184 |
| 99. | 27301 | 7.8% | 4.3%(+3.44)#99 | 4.9%(+2.84)#5,206 |
| 100. | 28034 | 7.7% | 4.3%(+3.39)#100 | 4.9%(+2.79)#5,261 |
Common Questions
What are the Top 10 Zip Codes with the Highest Percentage of Population Employed in Transportation & Warehousing in North Carolina?
Top 10 Zip Codes with the Highest Percentage of Population Employed in Transportation & Warehousing in North Carolina are:
What zip code has the Highest Percentage of Population Employed in Transportation & Warehousing in North Carolina?
28368 has the Highest Percentage of Population Employed in Transportation & Warehousing in North Carolina with 100.0%.
What is the Percentage of Population Employed in Transportation & Warehousing in the State of North Carolina?
Percentage of Population Employed in Transportation & Warehousing in North Carolina is 4.3%.
What is the Percentage of Population Employed in Transportation & Warehousing in the United States?
Percentage of Population Employed in Transportation & Warehousing in the United States is 4.9%.