Zip Codes with the Highest Percentage of Population Employed in Farming, Fishing & Forestry in Lumberton, NC
RELATED REPORTS & OPTIONS
Farming, Fishing & Forestry
Lumberton
Compare Zip Codes
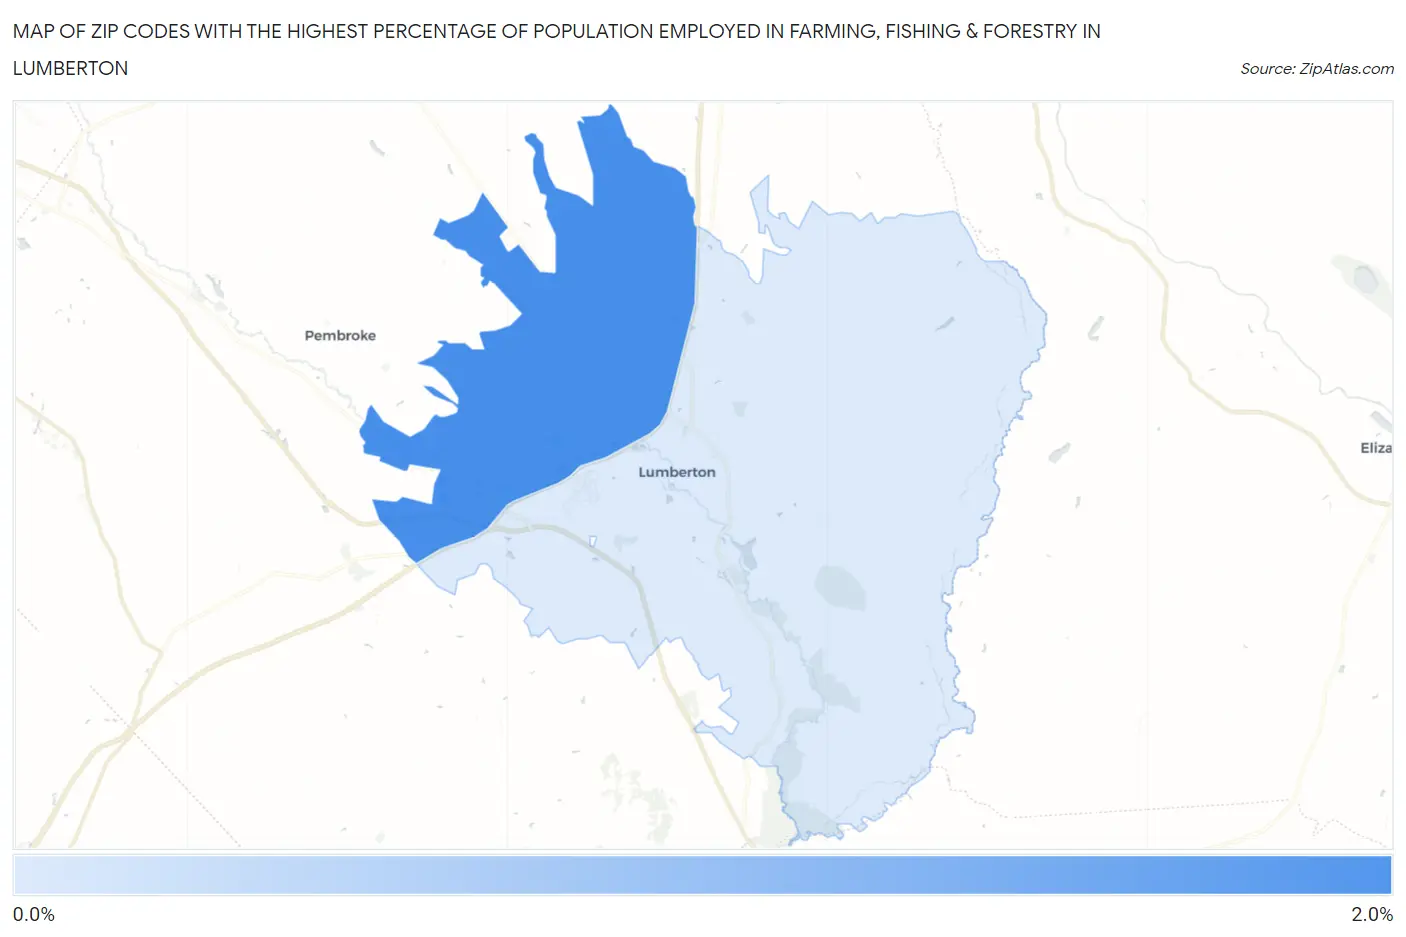
Map of Zip Codes with the Highest Percentage of Population Employed in Farming, Fishing & Forestry in Lumberton
0.0%
2.0%
Zip Codes with the Highest Percentage of Population Employed in Farming, Fishing & Forestry in Lumberton, NC
| Zip Code | % Employed | vs State | vs National | |
| 1. | 28360 | 1.5% | 0.51%(+1.04)#146 | 0.61%(+0.939)#7,758 |
| 2. | 28358 | 0.35% | 0.51%(-0.152)#365 | 0.61%(-0.253)#14,235 |
1
Common Questions
What are the Top Zip Codes with the Highest Percentage of Population Employed in Farming, Fishing & Forestry in Lumberton, NC?
Top Zip Codes with the Highest Percentage of Population Employed in Farming, Fishing & Forestry in Lumberton, NC are:
What zip code has the Highest Percentage of Population Employed in Farming, Fishing & Forestry in Lumberton, NC?
28360 has the Highest Percentage of Population Employed in Farming, Fishing & Forestry in Lumberton, NC with 1.5%.
What is the Percentage of Population Employed in Farming, Fishing & Forestry in Lumberton, NC?
Percentage of Population Employed in Farming, Fishing & Forestry in Lumberton is 0.37%.
What is the Percentage of Population Employed in Farming, Fishing & Forestry in North Carolina?
Percentage of Population Employed in Farming, Fishing & Forestry in North Carolina is 0.51%.
What is the Percentage of Population Employed in Farming, Fishing & Forestry in the United States?
Percentage of Population Employed in Farming, Fishing & Forestry in the United States is 0.61%.