Cities with the Highest Percentage of Population Employed in Agriculture, Fishing & Hunting in North Carolina
RELATED REPORTS & OPTIONS
Agriculture, Fishing & Hunting
North Carolina
Compare Cities
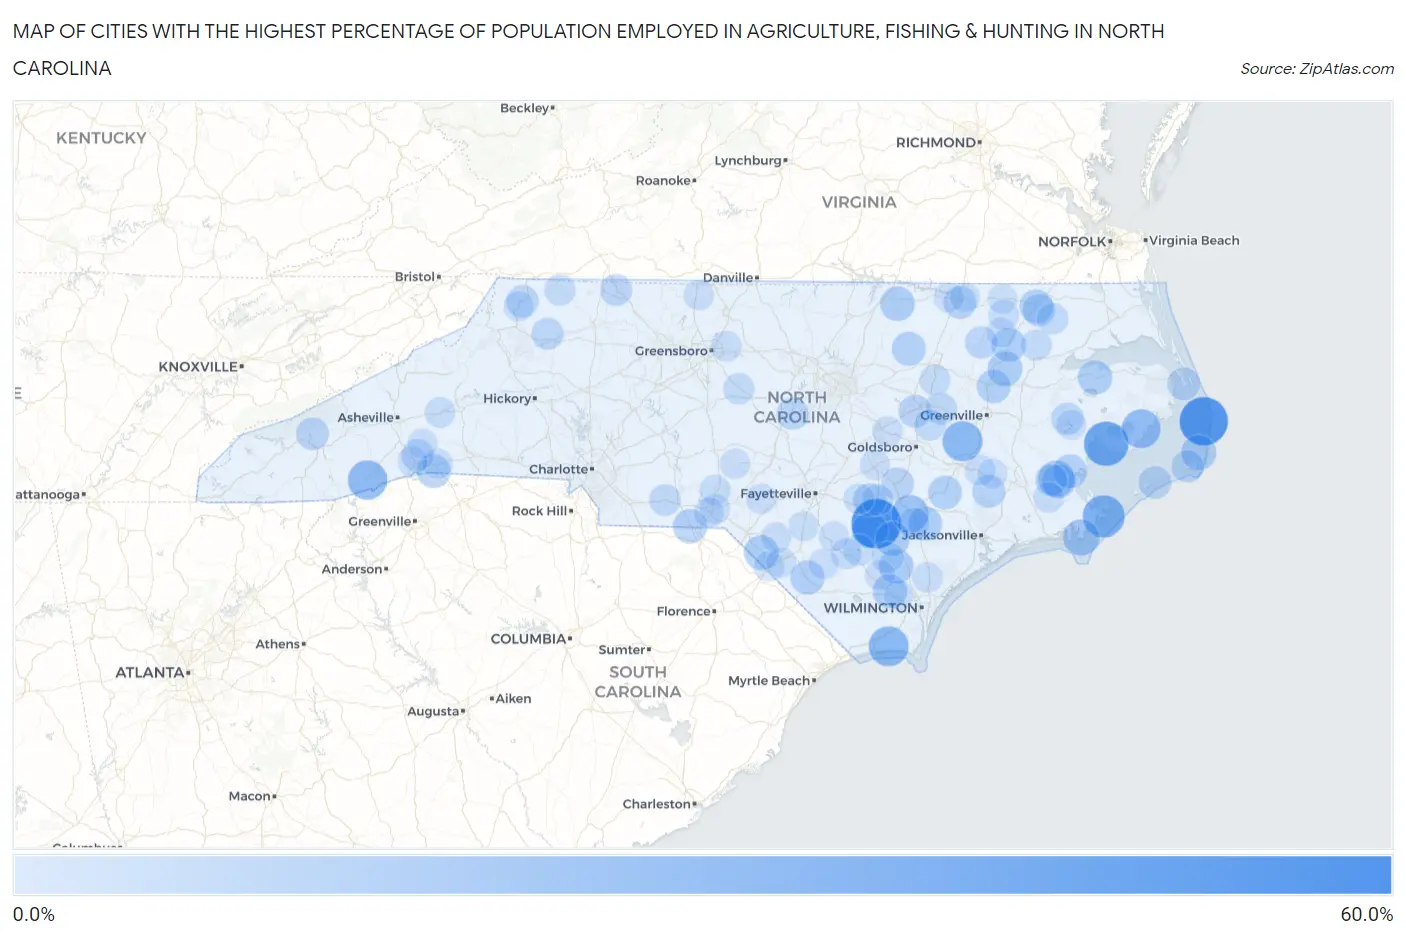
Map of Cities with the Highest Percentage of Population Employed in Agriculture, Fishing & Hunting in North Carolina
0.0%
60.0%
Cities with the Highest Percentage of Population Employed in Agriculture, Fishing & Hunting in North Carolina
| City | % Employed | vs State | vs National | |
| 1. | Ingold | 55.0% | 1.0%(+54.0)#1 | 1.2%(+53.8)#168 |
| 2. | Waves | 52.0% | 1.0%(+51.0)#2 | 1.2%(+50.8)#185 |
| 3. | Swan Quarter | 41.4% | 1.0%(+40.4)#3 | 1.2%(+40.2)#285 |
| 4. | Roberdel | 40.7% | 1.0%(+39.7)#4 | 1.2%(+39.5)#296 |
| 5. | Atlantic | 34.6% | 1.0%(+33.6)#5 | 1.2%(+33.4)#394 |
| 6. | Hookerton | 29.8% | 1.0%(+28.8)#6 | 1.2%(+28.6)#540 |
| 7. | Varnamtown | 29.0% | 1.0%(+28.0)#7 | 1.2%(+27.8)#557 |
| 8. | Bowdens | 29.0% | 1.0%(+28.0)#8 | 1.2%(+27.8)#558 |
| 9. | Rosman | 27.3% | 1.0%(+26.3)#9 | 1.2%(+26.1)#619 |
| 10. | Engelhard | 26.4% | 1.0%(+25.4)#10 | 1.2%(+25.2)#669 |
| 11. | Magnolia | 22.5% | 1.0%(+21.5)#11 | 1.2%(+21.3)#844 |
| 12. | Gloucester | 19.8% | 1.0%(+18.8)#12 | 1.2%(+18.6)#1,030 |
| 13. | Bayboro | 19.7% | 1.0%(+18.7)#13 | 1.2%(+18.5)#1,038 |
| 14. | Dudley | 19.2% | 1.0%(+18.2)#14 | 1.2%(+18.0)#1,074 |
| 15. | Garland | 19.1% | 1.0%(+18.1)#15 | 1.2%(+17.9)#1,081 |
| 16. | Avon | 16.3% | 1.0%(+15.3)#16 | 1.2%(+15.1)#1,339 |
| 17. | Hamilton | 15.7% | 1.0%(+14.7)#17 | 1.2%(+14.5)#1,403 |
| 18. | Atkinson | 15.7% | 1.0%(+14.7)#18 | 1.2%(+14.5)#1,407 |
| 19. | Raemon | 15.5% | 1.0%(+14.5)#19 | 1.2%(+14.3)#1,424 |
| 20. | Harrells | 15.4% | 1.0%(+14.4)#20 | 1.2%(+14.2)#1,441 |
| 21. | Warrenton | 15.1% | 1.0%(+14.1)#21 | 1.2%(+13.9)#1,477 |
| 22. | Riegelwood | 14.6% | 1.0%(+13.6)#22 | 1.2%(+13.4)#1,522 |
| 23. | Creswell | 14.5% | 1.0%(+13.5)#23 | 1.2%(+13.3)#1,539 |
| 24. | Lewiston Woodville | 14.4% | 1.0%(+13.4)#24 | 1.2%(+13.2)#1,557 |
| 25. | Greenevers | 14.0% | 1.0%(+13.0)#25 | 1.2%(+12.8)#1,599 |
| 26. | Mcfarlan | 14.0% | 1.0%(+12.9)#26 | 1.2%(+12.8)#1,614 |
| 27. | Boardman | 13.8% | 1.0%(+12.8)#27 | 1.2%(+12.6)#1,624 |
| 28. | Stonewall | 13.7% | 1.0%(+12.7)#28 | 1.2%(+12.5)#1,641 |
| 29. | Castalia | 13.5% | 1.0%(+12.5)#29 | 1.2%(+12.3)#1,673 |
| 30. | Mesic | 13.4% | 1.0%(+12.4)#30 | 1.2%(+12.2)#1,679 |
| 31. | Pink Hill | 13.3% | 1.0%(+12.2)#31 | 1.2%(+12.1)#1,708 |
| 32. | Winton | 13.1% | 1.0%(+12.1)#32 | 1.2%(+11.9)#1,738 |
| 33. | Parmele | 13.0% | 1.0%(+12.0)#33 | 1.2%(+11.8)#1,743 |
| 34. | Tryon | 12.9% | 1.0%(+11.8)#34 | 1.2%(+11.7)#1,777 |
| 35. | Bonnetsville | 12.6% | 1.0%(+11.6)#35 | 1.2%(+11.4)#1,804 |
| 36. | South Weldon | 11.2% | 1.0%(+10.2)#36 | 1.2%(+9.99)#2,099 |
| 37. | Trenton | 11.1% | 1.0%(+10.1)#37 | 1.2%(+9.91)#2,119 |
| 38. | Lucama | 10.9% | 1.0%(+9.87)#38 | 1.2%(+9.68)#2,180 |
| 39. | Wanchese | 10.7% | 1.0%(+9.65)#39 | 1.2%(+9.46)#2,242 |
| 40. | Ocracoke | 10.6% | 1.0%(+9.56)#40 | 1.2%(+9.36)#2,262 |
| 41. | Cherokee | 10.5% | 1.0%(+9.51)#41 | 1.2%(+9.32)#2,279 |
| 42. | Faison | 10.4% | 1.0%(+9.35)#42 | 1.2%(+9.15)#2,327 |
| 43. | Cofield | 10.0% | 1.0%(+8.99)#43 | 1.2%(+8.80)#2,422 |
| 44. | Pantego | 9.9% | 1.0%(+8.89)#44 | 1.2%(+8.70)#2,466 |
| 45. | Jefferson | 9.9% | 1.0%(+8.85)#45 | 1.2%(+8.66)#2,480 |
| 46. | Scotland Neck | 9.5% | 1.0%(+8.54)#46 | 1.2%(+8.35)#2,566 |
| 47. | Frisco | 9.4% | 1.0%(+8.40)#47 | 1.2%(+8.21)#2,617 |
| 48. | Millers Creek | 9.1% | 1.0%(+8.07)#48 | 1.2%(+7.88)#2,750 |
| 49. | Moncure | 9.0% | 1.0%(+8.04)#49 | 1.2%(+7.84)#2,760 |
| 50. | Dana | 9.0% | 1.0%(+8.00)#50 | 1.2%(+7.81)#2,771 |
| 51. | Toast | 8.7% | 1.0%(+7.74)#51 | 1.2%(+7.55)#2,855 |
| 52. | Alliance | 8.7% | 1.0%(+7.71)#52 | 1.2%(+7.51)#2,868 |
| 53. | Saratoga | 8.0% | 1.0%(+6.99)#53 | 1.2%(+6.80)#3,137 |
| 54. | Polkton | 7.8% | 1.0%(+6.80)#54 | 1.2%(+6.61)#3,214 |
| 55. | Rose Hill | 7.7% | 1.0%(+6.71)#55 | 1.2%(+6.52)#3,241 |
| 56. | White Lake | 7.6% | 1.0%(+6.64)#56 | 1.2%(+6.44)#3,302 |
| 57. | Eureka | 7.4% | 1.0%(+6.44)#57 | 1.2%(+6.25)#3,388 |
| 58. | Clinton | 7.4% | 1.0%(+6.42)#58 | 1.2%(+6.23)#3,394 |
| 59. | Ivanhoe | 7.4% | 1.0%(+6.35)#59 | 1.2%(+6.16)#3,418 |
| 60. | Sparta | 7.2% | 1.0%(+6.16)#60 | 1.2%(+5.96)#3,509 |
| 61. | Harrellsville | 7.1% | 1.0%(+6.05)#61 | 1.2%(+5.86)#3,569 |
| 62. | Staley | 7.0% | 1.0%(+5.97)#62 | 1.2%(+5.78)#3,609 |
| 63. | Askewville | 6.8% | 1.0%(+5.75)#63 | 1.2%(+5.56)#3,715 |
| 64. | Sharpsburg | 6.1% | 1.0%(+5.08)#64 | 1.2%(+4.89)#4,062 |
| 65. | Mcleansville | 5.7% | 1.0%(+4.71)#65 | 1.2%(+4.51)#4,288 |
| 66. | Dover | 5.7% | 1.0%(+4.69)#66 | 1.2%(+4.50)#4,306 |
| 67. | Salemburg | 5.7% | 1.0%(+4.69)#67 | 1.2%(+4.50)#4,309 |
| 68. | Arapahoe | 5.6% | 1.0%(+4.55)#68 | 1.2%(+4.36)#4,425 |
| 69. | Ellerbe | 5.5% | 1.0%(+4.54)#69 | 1.2%(+4.34)#4,444 |
| 70. | Old Fort | 5.5% | 1.0%(+4.51)#70 | 1.2%(+4.32)#4,463 |
| 71. | Rocky Point | 5.5% | 1.0%(+4.45)#71 | 1.2%(+4.26)#4,500 |
| 72. | Elizabethtown | 5.3% | 1.0%(+4.33)#72 | 1.2%(+4.14)#4,579 |
| 73. | Woodland | 5.1% | 1.0%(+4.12)#73 | 1.2%(+3.93)#4,740 |
| 74. | Cape Colony | 5.0% | 1.0%(+4.04)#74 | 1.2%(+3.85)#4,811 |
| 75. | Rockingham | 5.0% | 1.0%(+4.00)#75 | 1.2%(+3.81)#4,829 |
| 76. | Bladenboro | 4.9% | 1.0%(+3.92)#76 | 1.2%(+3.72)#4,894 |
| 77. | Seven Lakes | 4.9% | 1.0%(+3.91)#77 | 1.2%(+3.72)#4,899 |
| 78. | Columbus | 4.9% | 1.0%(+3.87)#78 | 1.2%(+3.68)#4,930 |
| 79. | Kelly | 4.9% | 1.0%(+3.85)#79 | 1.2%(+3.66)#4,949 |
| 80. | Cordova | 4.8% | 1.0%(+3.78)#80 | 1.2%(+3.59)#5,013 |
| 81. | Pine Level | 4.7% | 1.0%(+3.67)#81 | 1.2%(+3.48)#5,099 |
| 82. | White Oak | 4.6% | 1.0%(+3.61)#82 | 1.2%(+3.42)#5,146 |
| 83. | Rowland | 4.6% | 1.0%(+3.59)#83 | 1.2%(+3.40)#5,166 |
| 84. | Prospect | 4.5% | 1.0%(+3.52)#84 | 1.2%(+3.33)#5,230 |
| 85. | Five Points | 4.5% | 1.0%(+3.52)#85 | 1.2%(+3.33)#5,233 |
| 86. | St Pauls | 4.5% | 1.0%(+3.45)#86 | 1.2%(+3.25)#5,303 |
| 87. | Mcdonald | 4.4% | 1.0%(+3.44)#87 | 1.2%(+3.25)#5,316 |
| 88. | Newton Grove | 4.4% | 1.0%(+3.41)#88 | 1.2%(+3.22)#5,330 |
| 89. | East Flat Rock | 4.4% | 1.0%(+3.37)#89 | 1.2%(+3.18)#5,380 |
| 90. | Stoneville | 4.3% | 1.0%(+3.34)#90 | 1.2%(+3.15)#5,407 |
| 91. | West Jefferson | 4.3% | 1.0%(+3.25)#91 | 1.2%(+3.06)#5,504 |
| 92. | South Rosemary | 4.2% | 1.0%(+3.20)#92 | 1.2%(+3.01)#5,537 |
| 93. | Garysburg | 4.2% | 1.0%(+3.18)#93 | 1.2%(+2.98)#5,563 |
| 94. | Edneyville | 4.2% | 1.0%(+3.17)#94 | 1.2%(+2.98)#5,575 |
| 95. | Belhaven | 4.1% | 1.0%(+3.11)#95 | 1.2%(+2.92)#5,650 |
| 96. | Cove City | 4.0% | 1.0%(+3.01)#96 | 1.2%(+2.82)#5,746 |
| 97. | Conway | 3.9% | 1.0%(+2.89)#97 | 1.2%(+2.70)#5,875 |
| 98. | Roxobel | 3.9% | 1.0%(+2.86)#98 | 1.2%(+2.67)#5,906 |
| 99. | Northwest | 3.8% | 1.0%(+2.84)#99 | 1.2%(+2.65)#5,928 |
| 100. | Grandy | 3.8% | 1.0%(+2.82)#100 | 1.2%(+2.63)#5,966 |
Common Questions
What are the Top 10 Cities with the Highest Percentage of Population Employed in Agriculture, Fishing & Hunting in North Carolina?
Top 10 Cities with the Highest Percentage of Population Employed in Agriculture, Fishing & Hunting in North Carolina are:
#1
55.0%
#2
52.0%
#3
41.4%
#4
34.6%
#5
29.8%
#6
29.0%
#7
27.3%
#8
26.4%
#9
22.5%
#10
19.8%
What city has the Highest Percentage of Population Employed in Agriculture, Fishing & Hunting in North Carolina?
Ingold has the Highest Percentage of Population Employed in Agriculture, Fishing & Hunting in North Carolina with 55.0%.
What is the Percentage of Population Employed in Agriculture, Fishing & Hunting in the State of North Carolina?
Percentage of Population Employed in Agriculture, Fishing & Hunting in North Carolina is 1.0%.
What is the Percentage of Population Employed in Agriculture, Fishing & Hunting in the United States?
Percentage of Population Employed in Agriculture, Fishing & Hunting in the United States is 1.2%.