Zip Codes with the Highest Percentage of Households Heated by Bottled Gas / Liquid Propane in Burlington, NC
RELATED REPORTS & OPTIONS
Bottled Gas / LP Heating
Burlington
Compare Zip Codes
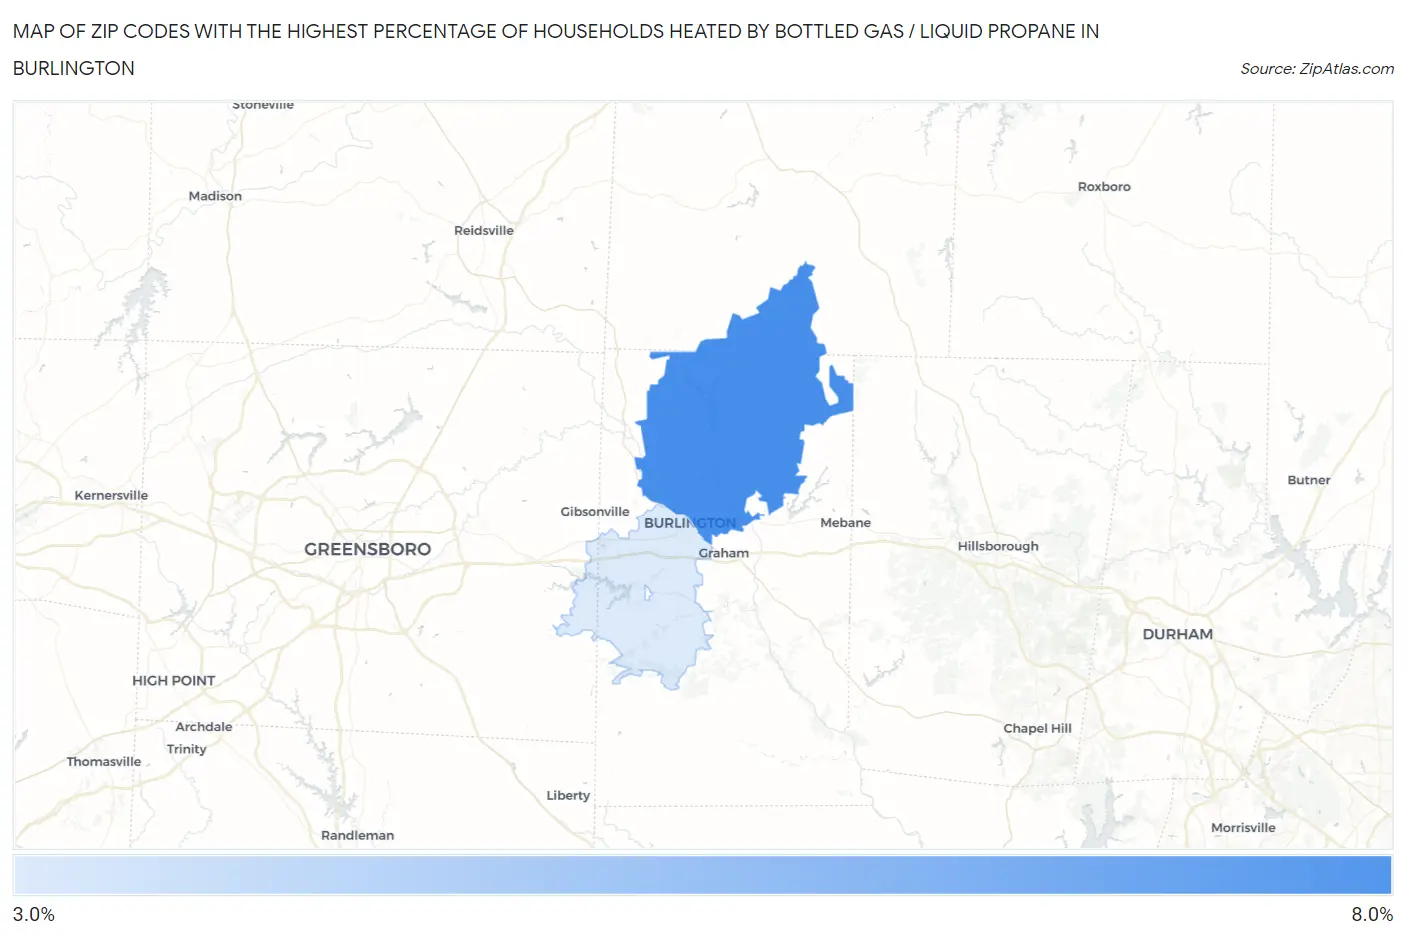
Map of Zip Codes with the Highest Percentage of Households Heated by Bottled Gas / Liquid Propane in Burlington
0.0%
8.0%
Zip Codes with the Highest Percentage of Households Heated by Bottled Gas / Liquid Propane in Burlington, NC
| Zip Code | Bottled Gas / LP Heating | vs State | vs National | |
| 1. | 27217 | 7.5% | 6.4%(+1.10)#466 | 4.9%(+2.60)#16,328 |
| 2. | 27215 | 3.9% | 6.4%(-2.50)#582 | 4.9%(-1.00)#19,714 |
1
Common Questions
What are the Top Zip Codes with the Highest Percentage of Households Heated by Bottled Gas / Liquid Propane in Burlington, NC?
Top Zip Codes with the Highest Percentage of Households Heated by Bottled Gas / Liquid Propane in Burlington, NC are:
What zip code has the Highest Percentage of Households Heated by Bottled Gas / Liquid Propane in Burlington, NC?
27217 has the Highest Percentage of Households Heated by Bottled Gas / Liquid Propane in Burlington, NC with 7.5%.
What is the Percentage of Households Heated by Bottled Gas / Liquid Propane in Burlington, NC?
Percentage of Households Heated by Bottled Gas / Liquid Propane in Burlington is 1.2%.
What is the Percentage of Households Heated by Bottled Gas / Liquid Propane in North Carolina?
Percentage of Households Heated by Bottled Gas / Liquid Propane in North Carolina is 6.4%.
What is the Percentage of Households Heated by Bottled Gas / Liquid Propane in the United States?
Percentage of Households Heated by Bottled Gas / Liquid Propane in the United States is 4.9%.