Zip Codes with the Highest Percentage of Population Employed in Transportation in Missoula, MT
RELATED REPORTS & OPTIONS
Transportation
Missoula
Compare Zip Codes
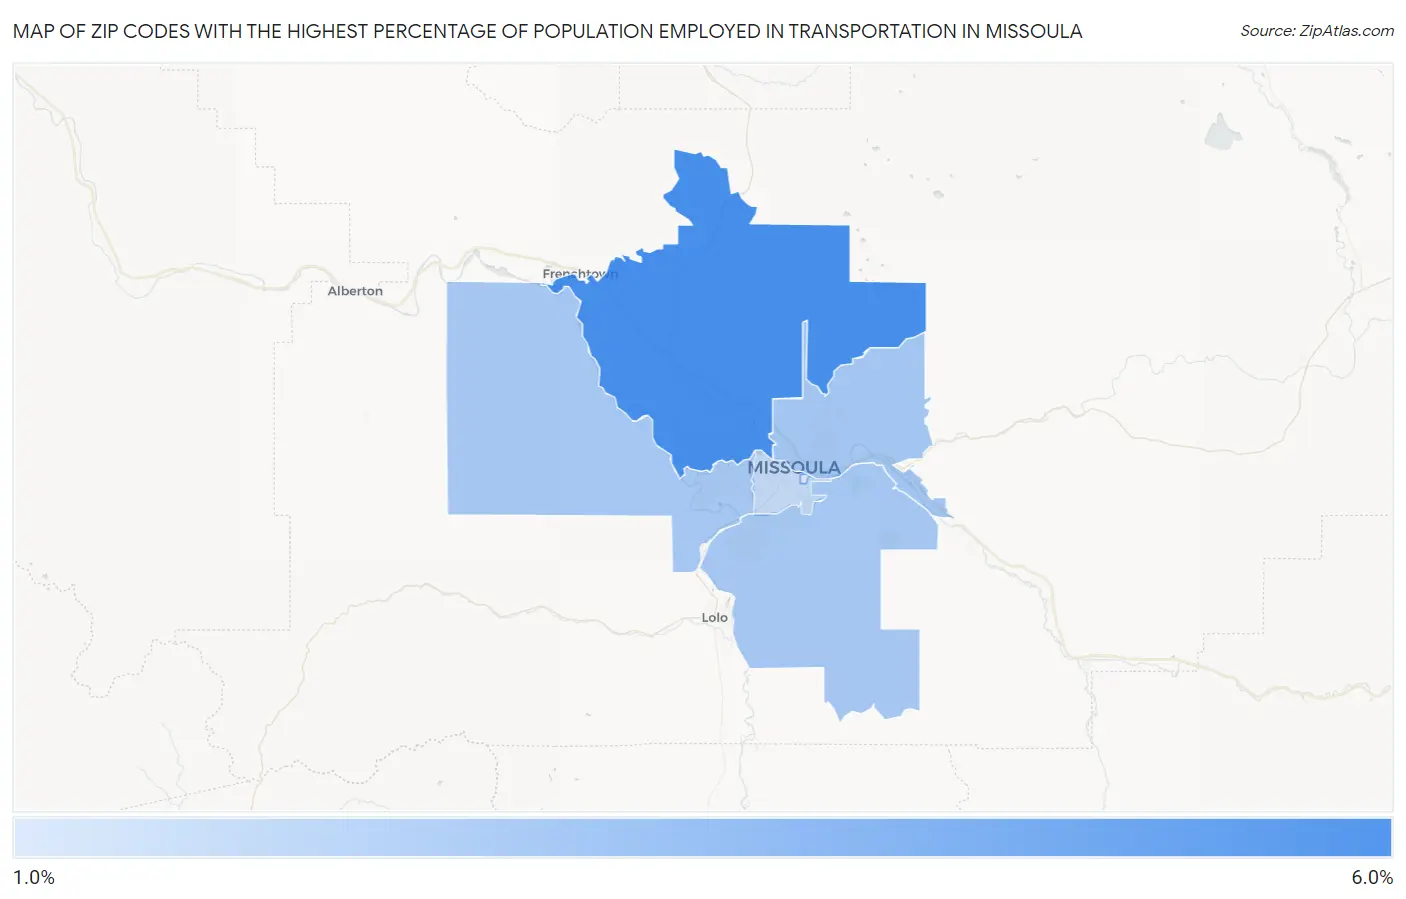
Map of Zip Codes with the Highest Percentage of Population Employed in Transportation in Missoula
0.0%
6.0%
Zip Codes with the Highest Percentage of Population Employed in Transportation in Missoula, MT
| Zip Code | % Employed | vs State | vs National | |
| 1. | 59808 | 5.8% | 3.7%(+2.07)#85 | 3.8%(+1.97)#7,912 |
| 2. | 59802 | 2.9% | 3.7%(-0.845)#183 | 3.8%(-0.951)#19,846 |
| 3. | 59803 | 2.8% | 3.7%(-0.883)#184 | 3.8%(-0.988)#20,022 |
| 4. | 59804 | 2.8% | 3.7%(-0.924)#185 | 3.8%(-1.03)#20,233 |
| 5. | 59801 | 2.0% | 3.7%(-1.76)#216 | 3.8%(-1.86)#23,840 |
| 6. | 59812 | 1.3% | 3.7%(-2.38)#238 | 3.8%(-2.48)#25,936 |
1
Common Questions
What are the Top 5 Zip Codes with the Highest Percentage of Population Employed in Transportation in Missoula, MT?
Top 5 Zip Codes with the Highest Percentage of Population Employed in Transportation in Missoula, MT are:
What zip code has the Highest Percentage of Population Employed in Transportation in Missoula, MT?
59808 has the Highest Percentage of Population Employed in Transportation in Missoula, MT with 5.8%.
What is the Percentage of Population Employed in Transportation in Missoula, MT?
Percentage of Population Employed in Transportation in Missoula is 3.0%.
What is the Percentage of Population Employed in Transportation in Montana?
Percentage of Population Employed in Transportation in Montana is 3.7%.
What is the Percentage of Population Employed in Transportation in the United States?
Percentage of Population Employed in Transportation in the United States is 3.8%.