Zip Codes with the Highest Percentage of Hispanic or Latino Population in Missoula, MT
RELATED REPORTS & OPTIONS
Hispanic or Latino
Missoula
Compare Zip Codes
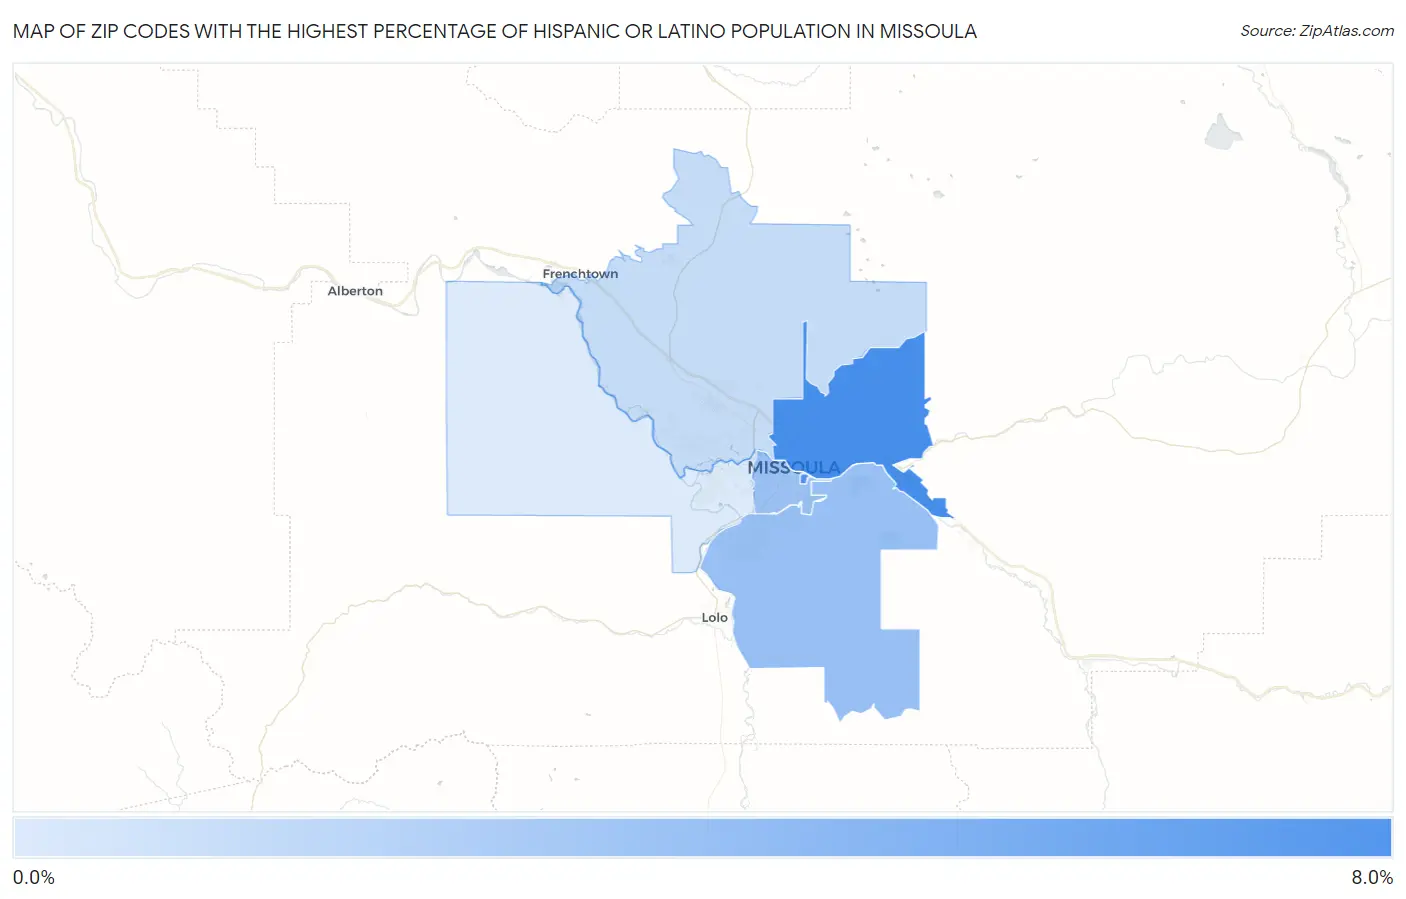
Map of Zip Codes with the Highest Percentage of Hispanic or Latino Population in Missoula
1.5%
7.0%
Zip Codes with the Highest Percentage of Hispanic or Latino Population in Missoula, MT
| Zip Code | Hispanic or Latino | vs State | vs National | |
| 1. | 59802 | 7.0% | 4.2%(+2.77)#36 | 18.7%(-11.7)#11,637 |
| 2. | 59812 | 6.7% | 4.2%(+2.47)#42 | 18.7%(-12.0)#11,978 |
| 3. | 59803 | 4.0% | 4.2%(-0.228)#95 | 18.7%(-14.7)#16,173 |
| 4. | 59801 | 3.8% | 4.2%(-0.378)#101 | 18.7%(-14.8)#16,454 |
| 5. | 59808 | 2.3% | 4.2%(-1.91)#156 | 18.7%(-16.4)#20,211 |
| 6. | 59804 | 1.5% | 4.2%(-2.75)#188 | 18.7%(-17.2)#22,715 |
1
Common Questions
What are the Top 5 Zip Codes with the Highest Percentage of Hispanic or Latino Population in Missoula, MT?
Top 5 Zip Codes with the Highest Percentage of Hispanic or Latino Population in Missoula, MT are:
What zip code has the Highest Percentage of Hispanic or Latino Population in Missoula, MT?
59802 has the Highest Percentage of Hispanic or Latino Population in Missoula, MT with 7.0%.
What is the Percentage of Hispanic or Latino Population in Missoula, MT?
Percentage of Hispanic or Latino Population in Missoula is 4.5%.
What is the Percentage of Hispanic or Latino Population in Montana?
Percentage of Hispanic or Latino Population in Montana is 4.2%.
What is the Percentage of Hispanic or Latino Population in the United States?
Percentage of Hispanic or Latino Population in the United States is 18.7%.