Zip Codes with the Highest Percentage of Households Residing in Detached Homes in Bozeman, MT
RELATED REPORTS & OPTIONS
Detached Home Residency
Bozeman
Compare Zip Codes
Map of Zip Codes with the Highest Percentage of Households Residing in Detached Homes in Bozeman
52.2%
58.2%
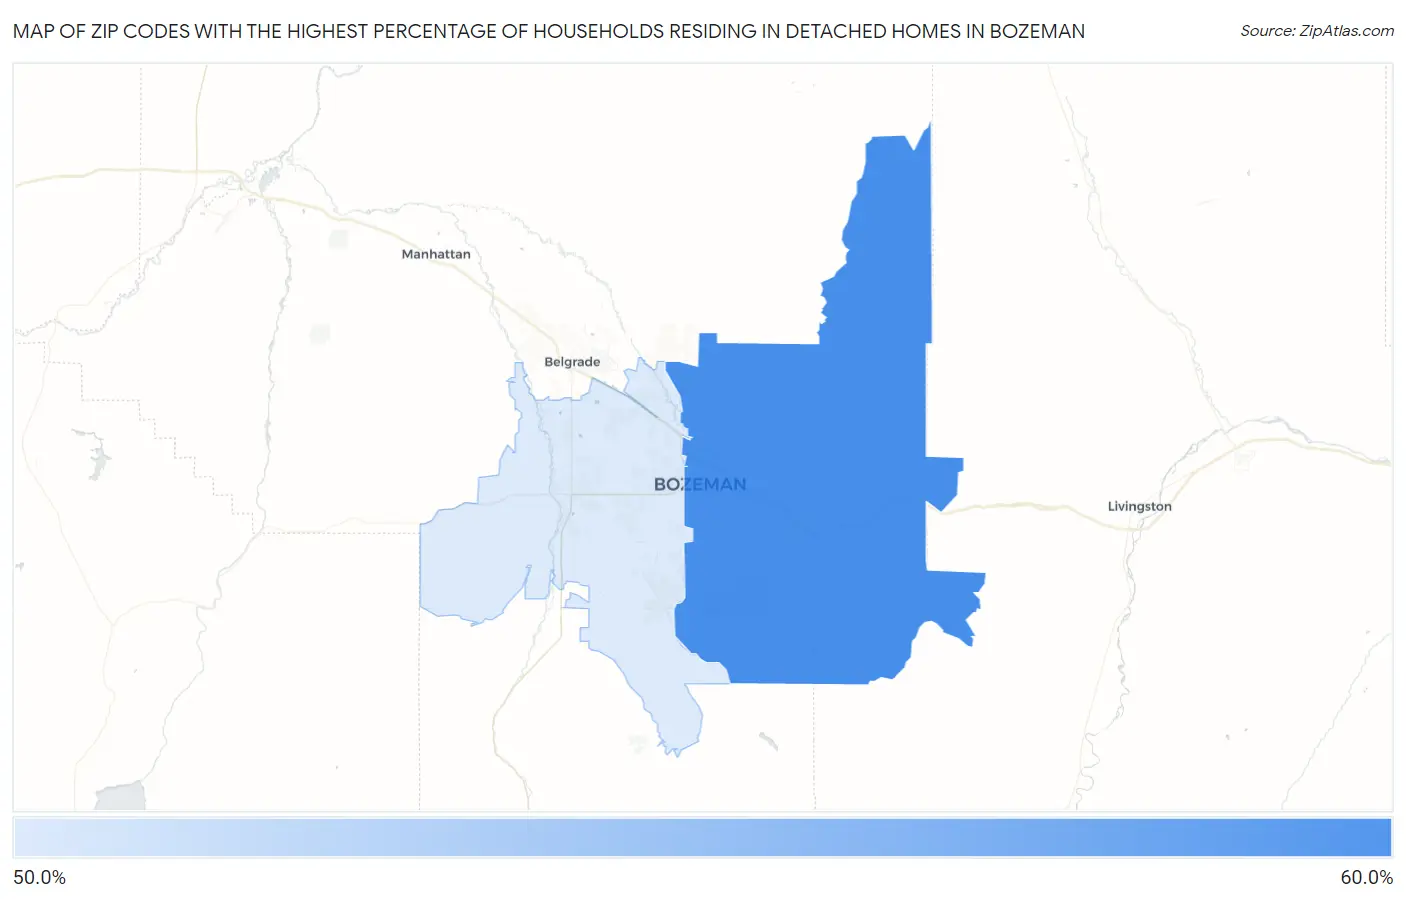
Zip Codes with the Highest Percentage of Households Residing in Detached Homes in Bozeman, MT
| Zip Code | Detached Home Residency | vs State | vs National | |
| 1. | 59715 | 58.2% | 69.5%(-11.3)#337 | 62.5%(-4.30)#27,099 |
| 2. | 59718 | 52.2% | 69.5%(-17.3)#349 | 62.5%(-10.3)#28,726 |
1
Common Questions
What are the Top Zip Codes with the Highest Percentage of Households Residing in Detached Homes in Bozeman, MT?
Top Zip Codes with the Highest Percentage of Households Residing in Detached Homes in Bozeman, MT are:
What zip code has the Highest Percentage of Households Residing in Detached Homes in Bozeman, MT?
59715 has the Highest Percentage of Households Residing in Detached Homes in Bozeman, MT with 58.2%.
What is the Percentage of Households Residing in Detached Homes in Bozeman, MT?
Percentage of Households Residing in Detached Homes in Bozeman is 42.8%.
What is the Percentage of Households Residing in Detached Homes in Montana?
Percentage of Households Residing in Detached Homes in Montana is 69.5%.
What is the Percentage of Households Residing in Detached Homes in the United States?
Percentage of Households Residing in Detached Homes in the United States is 62.5%.