Zip Codes with the Highest Percentage of Population Employed in Sales & Related in Jackson, MS
RELATED REPORTS & OPTIONS
Sales & Related
Jackson
Compare Zip Codes
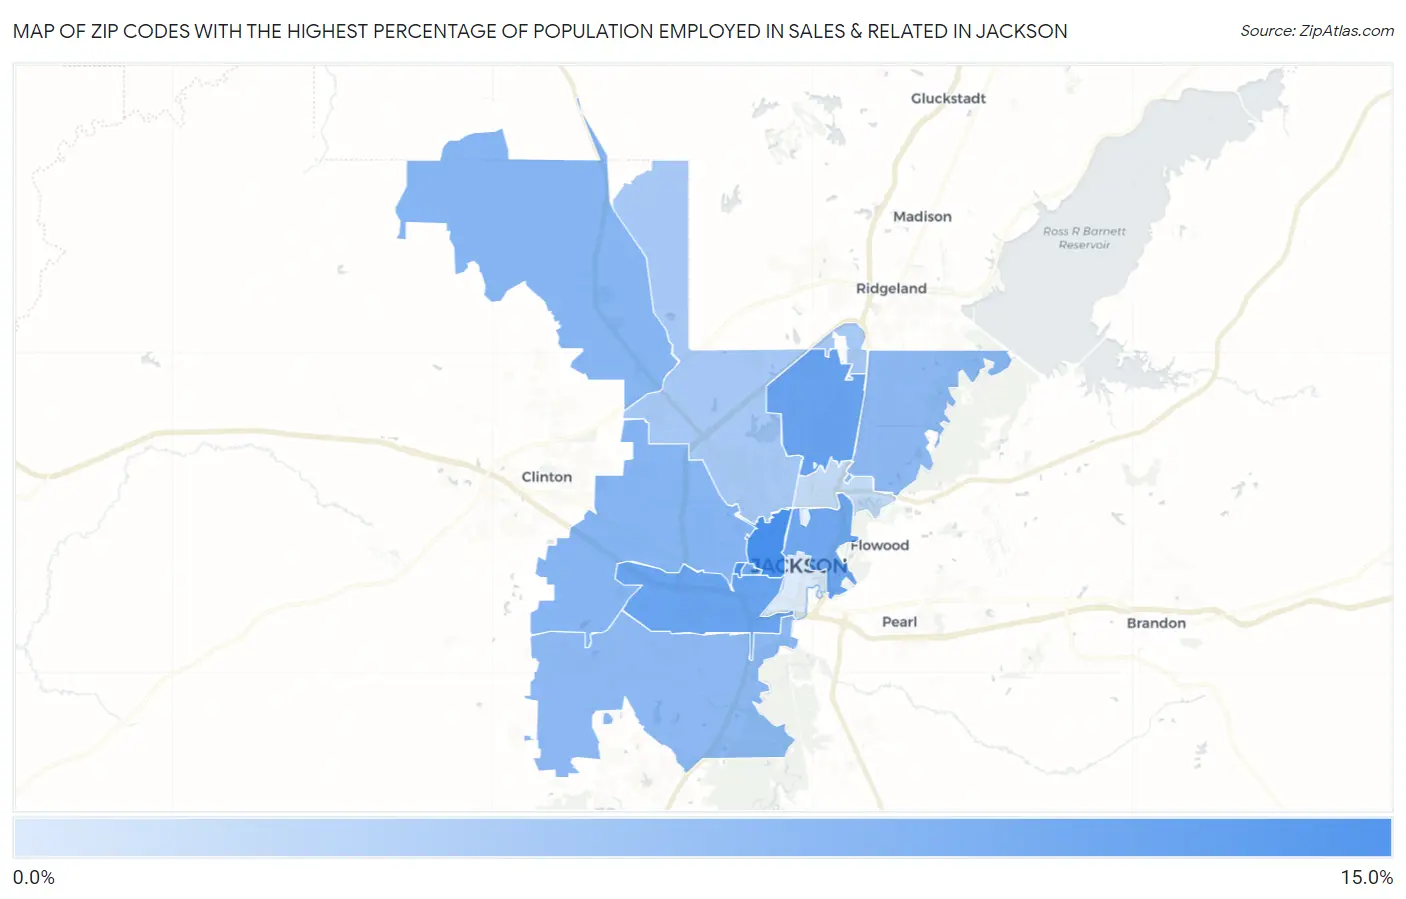
Map of Zip Codes with the Highest Percentage of Population Employed in Sales & Related in Jackson
1.9%
13.8%
Zip Codes with the Highest Percentage of Population Employed in Sales & Related in Jackson, MS
| Zip Code | % Employed | vs State | vs National | |
| 1. | 39203 | 13.8% | 9.8%(+4.03)#67 | 9.6%(+4.21)#3,639 |
| 2. | 39206 | 11.1% | 9.8%(+1.30)#124 | 9.6%(+1.49)#8,000 |
| 3. | 39204 | 11.0% | 9.8%(+1.20)#129 | 9.6%(+1.38)#8,268 |
| 4. | 39217 | 10.6% | 9.8%(+0.828)#136 | 9.6%(+1.01)#9,256 |
| 5. | 39202 | 10.4% | 9.8%(+0.665)#145 | 9.6%(+0.849)#9,678 |
| 6. | 39209 | 8.7% | 9.8%(-1.06)#202 | 9.6%(-0.880)#15,575 |
| 7. | 39211 | 8.3% | 9.8%(-1.53)#215 | 9.6%(-1.34)#17,236 |
| 8. | 39212 | 8.1% | 9.8%(-1.65)#220 | 9.6%(-1.47)#17,636 |
| 9. | 39213 | 6.2% | 9.8%(-3.62)#279 | 9.6%(-3.44)#23,299 |
| 10. | 39216 | 3.8% | 9.8%(-5.99)#332 | 9.6%(-5.80)#27,280 |
| 11. | 39201 | 1.9% | 9.8%(-7.84)#361 | 9.6%(-7.66)#29,016 |
1
Common Questions
What are the Top 10 Zip Codes with the Highest Percentage of Population Employed in Sales & Related in Jackson, MS?
Top 10 Zip Codes with the Highest Percentage of Population Employed in Sales & Related in Jackson, MS are:
What zip code has the Highest Percentage of Population Employed in Sales & Related in Jackson, MS?
39203 has the Highest Percentage of Population Employed in Sales & Related in Jackson, MS with 13.8%.
What is the Percentage of Population Employed in Sales & Related in Jackson, MS?
Percentage of Population Employed in Sales & Related in Jackson is 8.8%.
What is the Percentage of Population Employed in Sales & Related in Mississippi?
Percentage of Population Employed in Sales & Related in Mississippi is 9.8%.
What is the Percentage of Population Employed in Sales & Related in the United States?
Percentage of Population Employed in Sales & Related in the United States is 9.6%.