Cities with the Highest Percentage of Population Employed in Transportation & Warehousing in Mississippi
RELATED REPORTS & OPTIONS
Transportation & Warehousing
Mississippi
Compare Cities
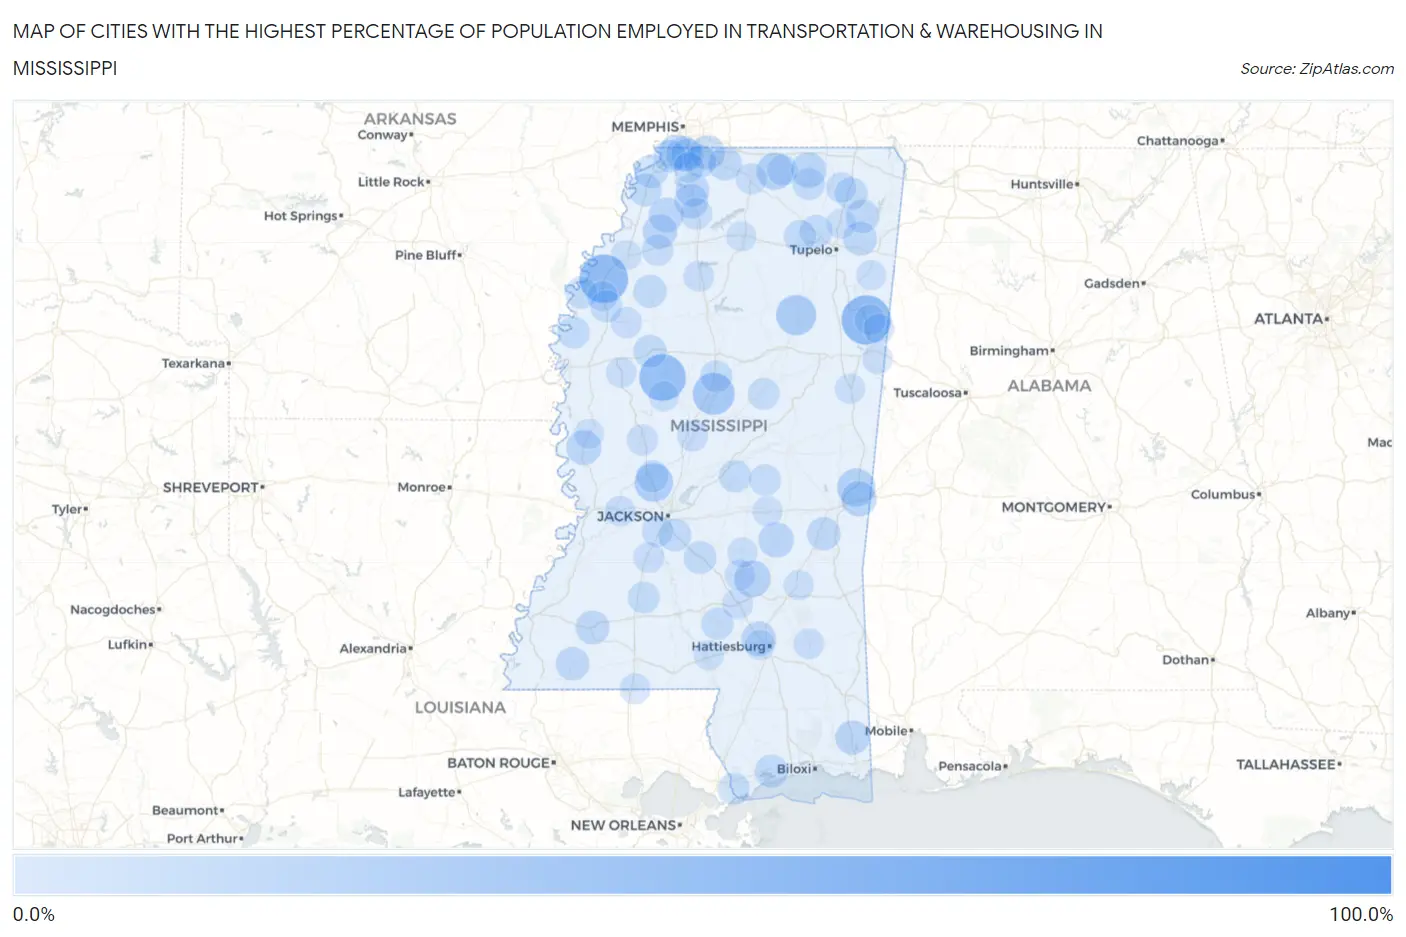
Map of Cities with the Highest Percentage of Population Employed in Transportation & Warehousing in Mississippi
0.0%
100.0%
Cities with the Highest Percentage of Population Employed in Transportation & Warehousing in Mississippi
| City | % Employed | vs State | vs National | |
| 1. | Stewart | 100.0% | 5.8%(+94.2)#1 | 4.9%(+95.1)#8 |
| 2. | New Hamilton | 49.1% | 5.8%(+43.3)#2 | 4.9%(+44.1)#132 |
| 3. | New Site | 47.8% | 5.8%(+41.9)#3 | 4.9%(+42.8)#141 |
| 4. | Duncan | 47.3% | 5.8%(+41.5)#4 | 4.9%(+42.3)#147 |
| 5. | Cruger | 43.0% | 5.8%(+37.2)#5 | 4.9%(+38.1)#171 |
| 6. | Paris | 41.3% | 5.8%(+35.5)#6 | 4.9%(+36.4)#186 |
| 7. | West | 32.7% | 5.8%(+26.9)#7 | 4.9%(+27.7)#319 |
| 8. | Eudora | 32.0% | 5.8%(+26.1)#8 | 4.9%(+27.0)#331 |
| 9. | Victoria | 29.6% | 5.8%(+23.8)#9 | 4.9%(+24.7)#375 |
| 10. | Randolph | 29.4% | 5.8%(+23.6)#10 | 4.9%(+24.5)#381 |
| 11. | Woodland | 29.0% | 5.8%(+23.1)#11 | 4.9%(+24.0)#394 |
| 12. | Arkabutla | 26.0% | 5.8%(+20.2)#12 | 4.9%(+21.1)#498 |
| 13. | Flora | 25.6% | 5.8%(+19.7)#13 | 4.9%(+20.6)#511 |
| 14. | Runnelstown | 25.2% | 5.8%(+19.3)#14 | 4.9%(+20.2)#533 |
| 15. | Bond | 24.7% | 5.8%(+18.8)#15 | 4.9%(+19.7)#560 |
| 16. | Lauderdale | 24.2% | 5.8%(+18.4)#16 | 4.9%(+19.3)#574 |
| 17. | Snow Lake Shores | 22.1% | 5.8%(+16.3)#17 | 4.9%(+17.2)#681 |
| 18. | Taylorsville | 20.7% | 5.8%(+14.9)#18 | 4.9%(+15.8)#777 |
| 19. | Bovina | 20.6% | 5.8%(+14.7)#19 | 4.9%(+15.6)#791 |
| 20. | Falkner | 18.8% | 5.8%(+13.0)#20 | 4.9%(+13.9)#927 |
| 21. | Toomsuba | 18.5% | 5.8%(+12.7)#21 | 4.9%(+13.6)#951 |
| 22. | Montrose | 18.4% | 5.8%(+12.5)#22 | 4.9%(+13.4)#975 |
| 23. | Lynchburg | 18.2% | 5.8%(+12.4)#23 | 4.9%(+13.3)#985 |
| 24. | Cary | 17.7% | 5.8%(+11.9)#24 | 4.9%(+12.8)#1,057 |
| 25. | Horn Lake | 17.5% | 5.8%(+11.7)#25 | 4.9%(+12.6)#1,090 |
| 26. | Crenshaw | 17.2% | 5.8%(+11.4)#26 | 4.9%(+12.2)#1,134 |
| 27. | Rawls Springs | 16.9% | 5.8%(+11.1)#27 | 4.9%(+12.0)#1,172 |
| 28. | Olive Branch | 16.9% | 5.8%(+11.1)#28 | 4.9%(+12.0)#1,179 |
| 29. | Falcon | 16.3% | 5.8%(+10.5)#29 | 4.9%(+11.4)#1,291 |
| 30. | Wade | 16.1% | 5.8%(+10.3)#30 | 4.9%(+11.1)#1,329 |
| 31. | Senatobia | 15.8% | 5.8%(+9.97)#31 | 4.9%(+10.9)#1,362 |
| 32. | Mantachie | 15.5% | 5.8%(+9.69)#32 | 4.9%(+10.6)#1,425 |
| 33. | Bude | 15.5% | 5.8%(+9.65)#33 | 4.9%(+10.5)#1,432 |
| 34. | Marietta | 15.0% | 5.8%(+9.17)#34 | 4.9%(+10.1)#1,536 |
| 35. | Byhalia | 14.9% | 5.8%(+9.11)#35 | 4.9%(+9.99)#1,548 |
| 36. | Coldwater | 14.9% | 5.8%(+9.05)#36 | 4.9%(+9.93)#1,568 |
| 37. | Gloster | 14.8% | 5.8%(+8.98)#37 | 4.9%(+9.86)#1,588 |
| 38. | Enterprise | 14.5% | 5.8%(+8.70)#38 | 4.9%(+9.58)#1,650 |
| 39. | Webb | 14.3% | 5.8%(+8.46)#39 | 4.9%(+9.34)#1,710 |
| 40. | Tunica Resorts | 14.2% | 5.8%(+8.34)#40 | 4.9%(+9.22)#1,757 |
| 41. | Delisle | 14.1% | 5.8%(+8.29)#41 | 4.9%(+9.17)#1,763 |
| 42. | Mississippi Valley State University | 14.0% | 5.8%(+8.13)#42 | 4.9%(+9.01)#1,806 |
| 43. | Tunica | 13.8% | 5.8%(+7.97)#43 | 4.9%(+8.85)#1,844 |
| 44. | Booneville | 13.3% | 5.8%(+7.52)#44 | 4.9%(+8.40)#1,961 |
| 45. | Southaven | 13.2% | 5.8%(+7.41)#45 | 4.9%(+8.29)#2,009 |
| 46. | Walls | 13.2% | 5.8%(+7.34)#46 | 4.9%(+8.22)#2,026 |
| 47. | Bridgetown | 13.1% | 5.8%(+7.28)#47 | 4.9%(+8.16)#2,046 |
| 48. | D Lo | 13.1% | 5.8%(+7.27)#48 | 4.9%(+8.15)#2,050 |
| 49. | Florence | 13.1% | 5.8%(+7.26)#49 | 4.9%(+8.14)#2,053 |
| 50. | Blue Springs | 13.0% | 5.8%(+7.22)#50 | 4.9%(+8.10)#2,067 |
| 51. | Kirkville | 12.5% | 5.8%(+6.67)#51 | 4.9%(+7.55)#2,244 |
| 52. | Ecru | 12.4% | 5.8%(+6.58)#52 | 4.9%(+7.46)#2,305 |
| 53. | Lena | 12.3% | 5.8%(+6.45)#53 | 4.9%(+7.33)#2,356 |
| 54. | Ripley | 12.2% | 5.8%(+6.34)#54 | 4.9%(+7.22)#2,403 |
| 55. | Bassfield | 12.0% | 5.8%(+6.13)#55 | 4.9%(+7.01)#2,483 |
| 56. | Pearlington | 11.9% | 5.8%(+6.11)#56 | 4.9%(+6.99)#2,493 |
| 57. | Benoit | 11.9% | 5.8%(+6.08)#57 | 4.9%(+6.96)#2,499 |
| 58. | Kearney Park | 11.7% | 5.8%(+5.89)#58 | 4.9%(+6.77)#2,596 |
| 59. | Gunnison | 11.6% | 5.8%(+5.80)#59 | 4.9%(+6.68)#2,626 |
| 60. | Merigold | 11.6% | 5.8%(+5.76)#60 | 4.9%(+6.64)#2,648 |
| 61. | Wesson | 11.3% | 5.8%(+5.49)#61 | 4.9%(+6.37)#2,795 |
| 62. | Vaiden | 11.3% | 5.8%(+5.44)#62 | 4.9%(+6.32)#2,819 |
| 63. | Como | 11.3% | 5.8%(+5.44)#63 | 4.9%(+6.32)#2,825 |
| 64. | Mccool | 11.1% | 5.8%(+5.28)#64 | 4.9%(+6.16)#2,911 |
| 65. | Sebastopol | 10.8% | 5.8%(+4.93)#65 | 4.9%(+5.81)#3,081 |
| 66. | Marks | 10.6% | 5.8%(+4.77)#66 | 4.9%(+5.65)#3,166 |
| 67. | Byram | 10.0% | 5.8%(+4.22)#67 | 4.9%(+5.10)#3,509 |
| 68. | Holly Springs | 9.9% | 5.8%(+4.10)#68 | 4.9%(+4.98)#3,586 |
| 69. | Yazoo City | 9.7% | 5.8%(+3.88)#69 | 4.9%(+4.76)#3,752 |
| 70. | Collins | 9.7% | 5.8%(+3.86)#70 | 4.9%(+4.74)#3,762 |
| 71. | Ruleville | 9.5% | 5.8%(+3.69)#71 | 4.9%(+4.57)#3,902 |
| 72. | Ashland | 9.2% | 5.8%(+3.39)#72 | 4.9%(+4.27)#4,116 |
| 73. | Oak Grove | 9.1% | 5.8%(+3.25)#73 | 4.9%(+4.13)#4,256 |
| 74. | Crystal Springs | 9.0% | 5.8%(+3.14)#74 | 4.9%(+4.02)#4,335 |
| 75. | Oakland | 8.8% | 5.8%(+3.02)#75 | 4.9%(+3.90)#4,450 |
| 76. | Hernando | 8.8% | 5.8%(+3.02)#76 | 4.9%(+3.90)#4,451 |
| 77. | Osyka | 8.8% | 5.8%(+2.97)#77 | 4.9%(+3.85)#4,496 |
| 78. | Mize | 8.7% | 5.8%(+2.91)#78 | 4.9%(+3.79)#4,551 |
| 79. | Hamilton | 8.7% | 5.8%(+2.87)#79 | 4.9%(+3.75)#4,602 |
| 80. | Edwards | 8.6% | 5.8%(+2.78)#80 | 4.9%(+3.66)#4,705 |
| 81. | Pickens | 8.5% | 5.8%(+2.62)#81 | 4.9%(+3.50)#4,844 |
| 82. | Richton | 8.4% | 5.8%(+2.57)#82 | 4.9%(+3.45)#4,897 |
| 83. | Winstonville | 8.3% | 5.8%(+2.51)#83 | 4.9%(+3.39)#4,989 |
| 84. | Caledonia | 8.2% | 5.8%(+2.40)#84 | 4.9%(+3.28)#5,109 |
| 85. | Inverness | 8.2% | 5.8%(+2.38)#85 | 4.9%(+3.26)#5,122 |
| 86. | Jumpertown | 8.2% | 5.8%(+2.37)#86 | 4.9%(+3.25)#5,134 |
| 87. | Tchula | 8.0% | 5.8%(+2.21)#87 | 4.9%(+3.09)#5,317 |
| 88. | Brooksville | 8.0% | 5.8%(+2.17)#88 | 4.9%(+3.05)#5,348 |
| 89. | Raleigh | 7.9% | 5.8%(+2.11)#89 | 4.9%(+2.99)#5,426 |
| 90. | Arnold Line | 7.8% | 5.8%(+1.99)#90 | 4.9%(+2.87)#5,591 |
| 91. | Lyon | 7.7% | 5.8%(+1.91)#91 | 4.9%(+2.79)#5,671 |
| 92. | Sandersville | 7.7% | 5.8%(+1.89)#92 | 4.9%(+2.77)#5,690 |
| 93. | Lake | 7.7% | 5.8%(+1.87)#93 | 4.9%(+2.75)#5,722 |
| 94. | New Hope | 7.6% | 5.8%(+1.81)#94 | 4.9%(+2.69)#5,824 |
| 95. | Guntown | 7.6% | 5.8%(+1.79)#95 | 4.9%(+2.67)#5,853 |
| 96. | Oxford | 7.6% | 5.8%(+1.77)#96 | 4.9%(+2.65)#5,865 |
| 97. | Eastabuchie | 7.6% | 5.8%(+1.74)#97 | 4.9%(+2.62)#5,923 |
| 98. | Smithville | 7.5% | 5.8%(+1.65)#98 | 4.9%(+2.53)#6,050 |
| 99. | Columbia | 7.4% | 5.8%(+1.62)#99 | 4.9%(+2.50)#6,085 |
| 100. | Rolling Fork | 7.4% | 5.8%(+1.58)#100 | 4.9%(+2.46)#6,148 |
Common Questions
What are the Top 10 Cities with the Highest Percentage of Population Employed in Transportation & Warehousing in Mississippi?
Top 10 Cities with the Highest Percentage of Population Employed in Transportation & Warehousing in Mississippi are:
#1
49.1%
#2
47.3%
#3
43.0%
#4
32.7%
#5
29.0%
#6
25.6%
#7
24.2%
#8
22.1%
#9
20.7%
#10
18.8%
What city has the Highest Percentage of Population Employed in Transportation & Warehousing in Mississippi?
New Hamilton has the Highest Percentage of Population Employed in Transportation & Warehousing in Mississippi with 49.1%.
What is the Percentage of Population Employed in Transportation & Warehousing in the State of Mississippi?
Percentage of Population Employed in Transportation & Warehousing in Mississippi is 5.8%.
What is the Percentage of Population Employed in Transportation & Warehousing in the United States?
Percentage of Population Employed in Transportation & Warehousing in the United States is 4.9%.