Zip Codes with the Highest Percentage of Population Employed in Construction & Extraction in Missouri
RELATED REPORTS & OPTIONS
Construction & Extraction
Missouri
Compare Zip Codes
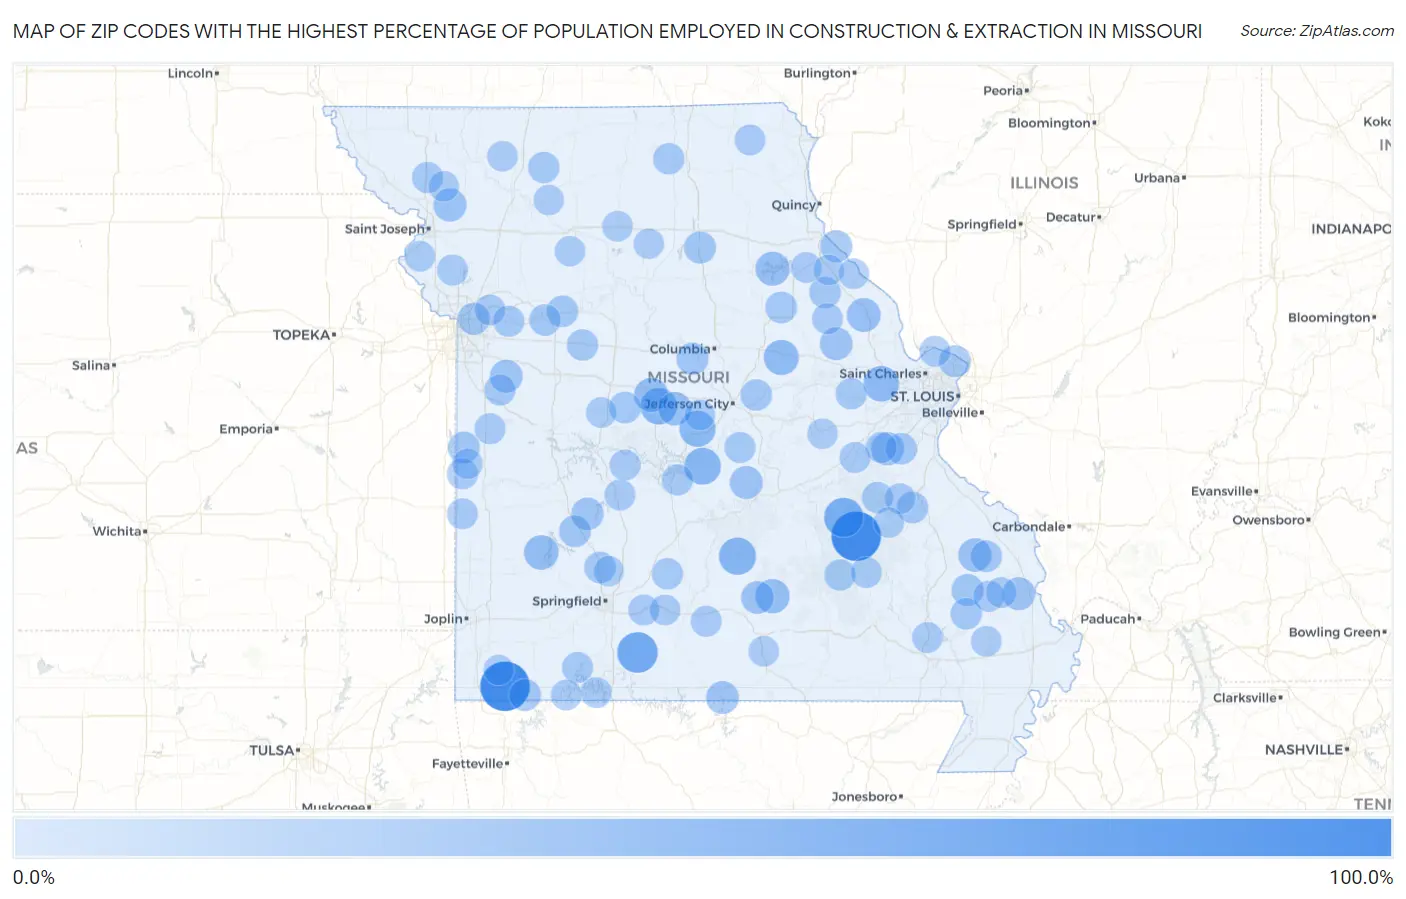
Map of Zip Codes with the Highest Percentage of Population Employed in Construction & Extraction in Missouri
0.0%
100.0%
Zip Codes with the Highest Percentage of Population Employed in Construction & Extraction in Missouri
| Zip Code | % Employed | vs State | vs National | |
| 1. | 65439 | 100.0% | 5.0%(+95.0)#1 | 5.0%(+95.0)#29 |
| 2. | 65730 | 100.0% | 5.0%(+95.0)#2 | 5.0%(+95.0)#38 |
| 3. | 65657 | 58.5% | 5.0%(+53.4)#3 | 5.0%(+53.5)#88 |
| 4. | 65456 | 52.9% | 5.0%(+47.9)#4 | 5.0%(+47.9)#109 |
| 5. | 65557 | 43.1% | 5.0%(+38.1)#5 | 5.0%(+38.1)#178 |
| 6. | 65083 | 41.4% | 5.0%(+36.4)#6 | 5.0%(+36.4)#197 |
| 7. | 65034 | 40.5% | 5.0%(+35.4)#7 | 5.0%(+35.5)#204 |
| 8. | 65064 | 38.2% | 5.0%(+33.2)#8 | 5.0%(+33.2)#241 |
| 9. | 63365 | 35.7% | 5.0%(+30.7)#9 | 5.0%(+30.7)#283 |
| 10. | 63388 | 33.4% | 5.0%(+28.4)#10 | 5.0%(+28.5)#321 |
| 11. | 65603 | 30.8% | 5.0%(+25.8)#11 | 5.0%(+25.8)#372 |
| 12. | 65354 | 29.7% | 5.0%(+24.7)#12 | 5.0%(+24.7)#406 |
| 13. | 65589 | 29.6% | 5.0%(+24.6)#13 | 5.0%(+24.6)#409 |
| 14. | 65283 | 29.0% | 5.0%(+23.9)#14 | 5.0%(+24.0)#425 |
| 15. | 63387 | 27.8% | 5.0%(+22.8)#15 | 5.0%(+22.8)#474 |
| 16. | 63662 | 26.5% | 5.0%(+21.5)#16 | 5.0%(+21.5)#531 |
| 17. | 65050 | 26.3% | 5.0%(+21.3)#17 | 5.0%(+21.3)#537 |
| 18. | 64459 | 25.0% | 5.0%(+20.0)#18 | 5.0%(+20.0)#590 |
| 19. | 63061 | 25.0% | 5.0%(+20.0)#19 | 5.0%(+20.0)#597 |
| 20. | 65459 | 24.1% | 5.0%(+19.1)#20 | 5.0%(+19.1)#639 |
| 21. | 63745 | 24.1% | 5.0%(+19.0)#21 | 5.0%(+19.1)#645 |
| 22. | 64090 | 23.4% | 5.0%(+18.4)#22 | 5.0%(+18.4)#692 |
| 23. | 65766 | 23.1% | 5.0%(+18.1)#23 | 5.0%(+18.1)#719 |
| 24. | 63381 | 23.0% | 5.0%(+18.0)#24 | 5.0%(+18.0)#722 |
| 25. | 65564 | 22.8% | 5.0%(+17.8)#25 | 5.0%(+17.8)#732 |
| 26. | 65650 | 21.2% | 5.0%(+16.2)#26 | 5.0%(+16.2)#871 |
| 27. | 65287 | 20.1% | 5.0%(+15.1)#27 | 5.0%(+15.1)#983 |
| 28. | 65247 | 20.0% | 5.0%(+15.0)#28 | 5.0%(+15.0)#991 |
| 29. | 64161 | 20.0% | 5.0%(+15.0)#29 | 5.0%(+15.0)#995 |
| 30. | 63467 | 20.0% | 5.0%(+15.0)#30 | 5.0%(+15.0)#1,003 |
| 31. | 63751 | 19.7% | 5.0%(+14.7)#31 | 5.0%(+14.7)#1,038 |
| 32. | 64722 | 19.4% | 5.0%(+14.3)#32 | 5.0%(+14.4)#1,081 |
| 33. | 65640 | 19.3% | 5.0%(+14.3)#33 | 5.0%(+14.3)#1,091 |
| 34. | 65745 | 19.1% | 5.0%(+14.1)#34 | 5.0%(+14.1)#1,117 |
| 35. | 63386 | 18.9% | 5.0%(+13.9)#35 | 5.0%(+13.9)#1,138 |
| 36. | 63653 | 18.6% | 5.0%(+13.6)#36 | 5.0%(+13.6)#1,190 |
| 37. | 65280 | 18.4% | 5.0%(+13.4)#37 | 5.0%(+13.4)#1,232 |
| 38. | 65345 | 18.4% | 5.0%(+13.4)#38 | 5.0%(+13.4)#1,237 |
| 39. | 63781 | 18.0% | 5.0%(+13.0)#39 | 5.0%(+13.0)#1,289 |
| 40. | 65617 | 17.9% | 5.0%(+12.9)#40 | 5.0%(+12.9)#1,316 |
| 41. | 63023 | 17.9% | 5.0%(+12.9)#41 | 5.0%(+12.9)#1,317 |
| 42. | 63339 | 17.8% | 5.0%(+12.8)#42 | 5.0%(+12.8)#1,323 |
| 43. | 64022 | 17.6% | 5.0%(+12.6)#43 | 5.0%(+12.7)#1,358 |
| 44. | 65080 | 17.4% | 5.0%(+12.4)#44 | 5.0%(+12.5)#1,392 |
| 45. | 63787 | 17.4% | 5.0%(+12.4)#45 | 5.0%(+12.4)#1,400 |
| 46. | 64067 | 17.2% | 5.0%(+12.2)#46 | 5.0%(+12.3)#1,425 |
| 47. | 64642 | 17.0% | 5.0%(+12.0)#47 | 5.0%(+12.1)#1,463 |
| 48. | 65327 | 17.0% | 5.0%(+12.0)#48 | 5.0%(+12.0)#1,469 |
| 49. | 63559 | 16.6% | 5.0%(+11.6)#49 | 5.0%(+11.7)#1,560 |
| 50. | 65713 | 16.3% | 5.0%(+11.3)#50 | 5.0%(+11.3)#1,639 |
| 51. | 63629 | 16.2% | 5.0%(+11.2)#51 | 5.0%(+11.2)#1,653 |
| 52. | 64427 | 16.0% | 5.0%(+11.0)#52 | 5.0%(+11.0)#1,723 |
| 53. | 65624 | 15.9% | 5.0%(+10.9)#53 | 5.0%(+10.9)#1,734 |
| 54. | 63357 | 15.8% | 5.0%(+10.7)#54 | 5.0%(+10.8)#1,780 |
| 55. | 65058 | 15.6% | 5.0%(+10.6)#55 | 5.0%(+10.6)#1,811 |
| 56. | 64066 | 15.6% | 5.0%(+10.6)#56 | 5.0%(+10.6)#1,816 |
| 57. | 63664 | 15.6% | 5.0%(+10.6)#57 | 5.0%(+10.6)#1,829 |
| 58. | 65052 | 15.5% | 5.0%(+10.5)#58 | 5.0%(+10.5)#1,841 |
| 59. | 64743 | 15.5% | 5.0%(+10.4)#59 | 5.0%(+10.5)#1,864 |
| 60. | 63060 | 15.4% | 5.0%(+10.4)#60 | 5.0%(+10.4)#1,867 |
| 61. | 64720 | 15.3% | 5.0%(+10.3)#61 | 5.0%(+10.3)#1,898 |
| 62. | 65732 | 15.3% | 5.0%(+10.3)#62 | 5.0%(+10.3)#1,909 |
| 63. | 64444 | 15.2% | 5.0%(+10.2)#63 | 5.0%(+10.2)#1,950 |
| 64. | 63760 | 15.1% | 5.0%(+10.1)#64 | 5.0%(+10.1)#1,973 |
| 65. | 63633 | 15.1% | 5.0%(+10.0)#65 | 5.0%(+10.1)#1,996 |
| 66. | 65717 | 15.1% | 5.0%(+10.0)#66 | 5.0%(+10.1)#1,997 |
| 67. | 64752 | 14.9% | 5.0%(+9.91)#67 | 5.0%(+9.93)#2,053 |
| 68. | 65326 | 14.8% | 5.0%(+9.82)#68 | 5.0%(+9.84)#2,089 |
| 69. | 63359 | 14.8% | 5.0%(+9.79)#69 | 5.0%(+9.82)#2,096 |
| 70. | 63080 | 14.6% | 5.0%(+9.58)#70 | 5.0%(+9.60)#2,197 |
| 71. | 63660 | 14.4% | 5.0%(+9.37)#71 | 5.0%(+9.40)#2,281 |
| 72. | 65652 | 14.3% | 5.0%(+9.31)#72 | 5.0%(+9.33)#2,302 |
| 73. | 63373 | 14.3% | 5.0%(+9.30)#73 | 5.0%(+9.33)#2,305 |
| 74. | 64741 | 14.1% | 5.0%(+9.10)#74 | 5.0%(+9.12)#2,404 |
| 75. | 64072 | 14.0% | 5.0%(+9.03)#75 | 5.0%(+9.06)#2,437 |
| 76. | 65611 | 14.0% | 5.0%(+9.01)#76 | 5.0%(+9.04)#2,445 |
| 77. | 63436 | 14.0% | 5.0%(+8.99)#77 | 5.0%(+9.01)#2,454 |
| 78. | 63543 | 14.0% | 5.0%(+8.98)#78 | 5.0%(+9.01)#2,456 |
| 79. | 65658 | 13.9% | 5.0%(+8.92)#79 | 5.0%(+8.94)#2,491 |
| 80. | 63967 | 13.9% | 5.0%(+8.89)#80 | 5.0%(+8.91)#2,503 |
| 81. | 65746 | 13.8% | 5.0%(+8.77)#81 | 5.0%(+8.80)#2,550 |
| 82. | 63785 | 13.8% | 5.0%(+8.77)#82 | 5.0%(+8.79)#2,551 |
| 83. | 64651 | 13.6% | 5.0%(+8.60)#83 | 5.0%(+8.62)#2,649 |
| 84. | 64440 | 13.5% | 5.0%(+8.53)#84 | 5.0%(+8.55)#2,683 |
| 85. | 65335 | 13.5% | 5.0%(+8.49)#85 | 5.0%(+8.52)#2,698 |
| 86. | 63825 | 13.4% | 5.0%(+8.42)#86 | 5.0%(+8.45)#2,733 |
| 87. | 64471 | 13.4% | 5.0%(+8.40)#87 | 5.0%(+8.43)#2,746 |
| 88. | 63441 | 13.4% | 5.0%(+8.38)#88 | 5.0%(+8.40)#2,754 |
| 89. | 63353 | 13.4% | 5.0%(+8.37)#89 | 5.0%(+8.40)#2,756 |
| 90. | 64745 | 13.2% | 5.0%(+8.14)#90 | 5.0%(+8.16)#2,859 |
| 91. | 63631 | 13.1% | 5.0%(+8.08)#91 | 5.0%(+8.10)#2,880 |
| 92. | 64480 | 13.0% | 5.0%(+8.02)#92 | 5.0%(+8.05)#2,907 |
| 93. | 64867 | 13.0% | 5.0%(+7.97)#93 | 5.0%(+7.99)#2,940 |
| 94. | 64658 | 12.9% | 5.0%(+7.90)#94 | 5.0%(+7.93)#2,977 |
| 95. | 64638 | 12.9% | 5.0%(+7.88)#95 | 5.0%(+7.91)#2,990 |
| 96. | 65074 | 12.9% | 5.0%(+7.86)#96 | 5.0%(+7.88)#3,004 |
| 97. | 64648 | 12.9% | 5.0%(+7.85)#97 | 5.0%(+7.88)#3,005 |
| 98. | 63091 | 12.9% | 5.0%(+7.85)#98 | 5.0%(+7.88)#3,006 |
| 99. | 65789 | 12.8% | 5.0%(+7.82)#99 | 5.0%(+7.85)#3,020 |
| 100. | 65725 | 12.8% | 5.0%(+7.82)#100 | 5.0%(+7.84)#3,025 |
Common Questions
What are the Top 10 Zip Codes with the Highest Percentage of Population Employed in Construction & Extraction in Missouri?
Top 10 Zip Codes with the Highest Percentage of Population Employed in Construction & Extraction in Missouri are:
What zip code has the Highest Percentage of Population Employed in Construction & Extraction in Missouri?
65439 has the Highest Percentage of Population Employed in Construction & Extraction in Missouri with 100.0%.
What is the Percentage of Population Employed in Construction & Extraction in the State of Missouri?
Percentage of Population Employed in Construction & Extraction in Missouri is 5.0%.
What is the Percentage of Population Employed in Construction & Extraction in the United States?
Percentage of Population Employed in Construction & Extraction in the United States is 5.0%.