Zip Codes with the Highest Percentage of Hispanic or Latino Population in Springfield, MO
RELATED REPORTS & OPTIONS
Hispanic or Latino
Springfield
Compare Zip Codes
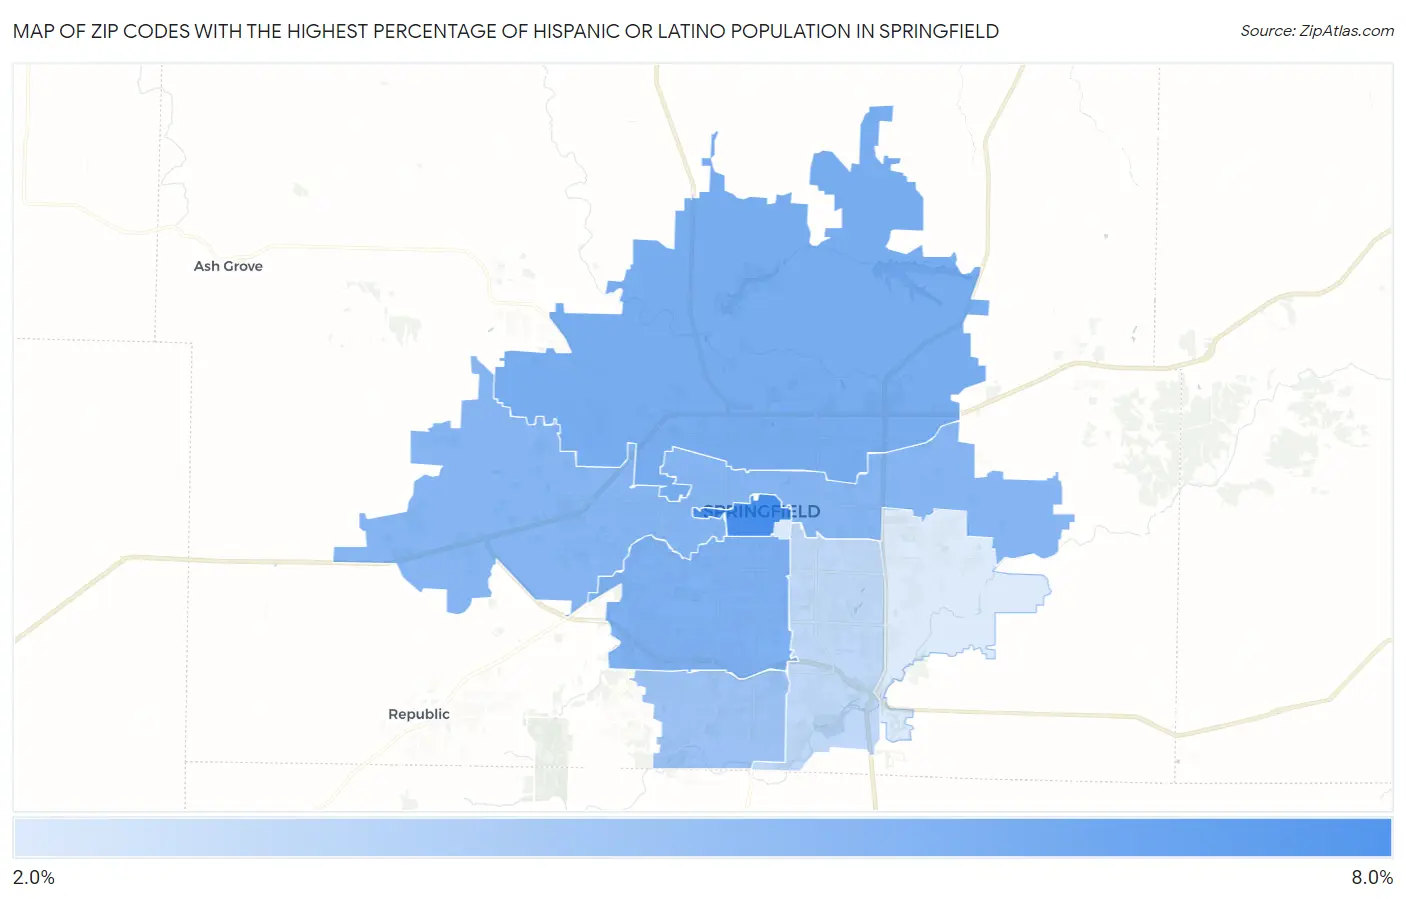
Map of Zip Codes with the Highest Percentage of Hispanic or Latino Population in Springfield
2.2%
6.5%
Zip Codes with the Highest Percentage of Hispanic or Latino Population in Springfield, MO
| Zip Code | Hispanic or Latino | vs State | vs National | |
| 1. | 65806 | 6.5% | 4.6%(+1.96)#133 | 18.7%(-12.1)#12,170 |
| 2. | 65803 | 5.1% | 4.6%(+0.592)#187 | 18.7%(-13.5)#14,042 |
| 3. | 65807 | 4.9% | 4.6%(+0.357)#200 | 18.7%(-13.7)#14,438 |
| 4. | 65802 | 4.7% | 4.6%(+0.171)#210 | 18.7%(-13.9)#14,762 |
| 5. | 65810 | 4.1% | 4.6%(-0.405)#238 | 18.7%(-14.5)#15,844 |
| 6. | 65804 | 3.1% | 4.6%(-1.45)#311 | 18.7%(-15.6)#18,112 |
| 7. | 65897 | 2.3% | 4.6%(-2.24)#411 | 18.7%(-16.3)#20,170 |
| 8. | 65809 | 2.2% | 4.6%(-2.32)#427 | 18.7%(-16.4)#20,387 |
1
Common Questions
What are the Top 5 Zip Codes with the Highest Percentage of Hispanic or Latino Population in Springfield, MO?
Top 5 Zip Codes with the Highest Percentage of Hispanic or Latino Population in Springfield, MO are:
What zip code has the Highest Percentage of Hispanic or Latino Population in Springfield, MO?
65806 has the Highest Percentage of Hispanic or Latino Population in Springfield, MO with 6.5%.
What is the Percentage of Hispanic or Latino Population in Springfield, MO?
Percentage of Hispanic or Latino Population in Springfield is 4.6%.
What is the Percentage of Hispanic or Latino Population in Missouri?
Percentage of Hispanic or Latino Population in Missouri is 4.6%.
What is the Percentage of Hispanic or Latino Population in the United States?
Percentage of Hispanic or Latino Population in the United States is 18.7%.