Zip Codes with the Highest Percentage of Self-Employed / Incorporated in Kansas City, MO

RELATED REPORTS & OPTIONS

Self-Employed / Incorporated
Population
Families and Households
Female Fertility
Female Fertility (Unmarried)
Race (Community Size)
Race (Percentage)
Ancestry (Community Size)
AfghanAfricanAlaska NativeAlbanianAmericanApacheArabArgentineanArmenianAustralianAustrianBahamianBangladeshiBelgianBelizeanBhutaneseBlackfeetBolivianBrazilianBritishBulgarianBurmeseCanadianCelticCentral AmericanCentral American IndianCherokeeChickasawChileanChippewaChoctawColombianComancheCosta RicanCreeCreekCroatianCrowCubanCzechCzechoslovakianDanishDominicanDutchDutch West IndianEastern EuropeanEcuadorianEgyptianEnglishEthiopianEuropeanFijianFilipinoFinnishFrenchFrench American IndianFrench CanadianGermanGerman RussianGhanaianGreekGuamanian / ChamorroGuatemalanGuyaneseHaitianHonduranHungarianIcelanderIndian (Asian)IndonesianIranianIraqiIrishIroquoisIsraeliItalianJamaicanJapaneseJordanianKenyanKoreanLaotianLatvianLebaneseLiberianLithuanianLuxembourgerMalaysianMexicanMexican American IndianMongolianMoroccanNative HawaiianNavajoNew ZealanderNicaraguanNigerianNorthern EuropeanNorwegianOsageOttawaPakistaniPalestinianPanamanianPennsylvania GermanPeruvianPolishPortuguesePotawatomiPuebloPuerto RicanRomanianRussianSalvadoranSamoanScandinavianScotch-IrishScottishSeminoleSerbianShoshoneSierra LeoneanSiouxSlavicSlovakSloveneSomaliSouth AfricanSouth AmericanSouth American IndianSpaniardSpanishSri LankanSubsaharan AfricanSudaneseSwedishSwissSyrianThaiTrinidadian and TobagonianTurkishUgandanUkrainianUruguayanVenezuelanVietnameseWelshWest IndianYugoslavian
Ancestry (Percentage)
AfghanAfricanAlaska NativeAlbanianAmericanApacheArabArgentineanArmenianAustralianAustrianBahamianBangladeshiBelgianBelizeanBhutaneseBlackfeetBolivianBrazilianBritishBulgarianBurmeseCanadianCelticCentral AmericanCentral American IndianCherokeeChickasawChileanChippewaChoctawColombianComancheCosta RicanCreeCreekCroatianCrowCubanCzechCzechoslovakianDanishDominicanDutchDutch West IndianEastern EuropeanEcuadorianEgyptianEnglishEthiopianEuropeanFijianFilipinoFinnishFrenchFrench American IndianFrench CanadianGermanGerman RussianGhanaianGreekGuamanian / ChamorroGuatemalanGuyaneseHaitianHonduranHungarianIcelanderIndian (Asian)IndonesianIranianIraqiIrishIroquoisIsraeliItalianJamaicanJapaneseJordanianKenyanKoreanLaotianLatvianLebaneseLiberianLithuanianLuxembourgerMalaysianMexicanMexican American IndianMongolianMoroccanNative HawaiianNavajoNew ZealanderNicaraguanNigerianNorthern EuropeanNorwegianOsageOttawaPakistaniPalestinianPanamanianPennsylvania GermanPeruvianPolishPortuguesePotawatomiPuebloPuerto RicanRomanianRussianSalvadoranSamoanScandinavianScotch-IrishScottishSeminoleSerbianShoshoneSierra LeoneanSiouxSlavicSlovakSloveneSomaliSouth AfricanSouth AmericanSouth American IndianSpaniardSpanishSri LankanSubsaharan AfricanSudaneseSwedishSwissSyrianThaiTrinidadian and TobagonianTurkishUgandanUkrainianUruguayanVenezuelanVietnameseWelshWest IndianYugoslavian
Immigrant Origin (Total)
AfghanistanAfricaArgentinaAsiaAustraliaBahamasBangladeshBelarusBelgiumBelizeBoliviaBosnia and HerzegovinaBrazilBulgariaBurma / MyanmarCambodiaCameroonCanadaCaribbeanCentral AmericaChileChinaColombiaCongoCosta RicaCubaCzechoslovakiaDenmarkDominican RepublicEastern AfricaEastern AsiaEastern EuropeEcuadorEgyptEl SalvadorEnglandEritreaEthiopiaEuropeFijiFranceGermanyGhanaGreeceGuatemalaGuyanaHaitiHondurasHong KongHungaryIndiaIndonesiaIranIraqIrelandIsraelItalyJamaicaJapanJordanKazakhstanKenyaKoreaKuwaitLaosLatin AmericaLebanonLiberiaMalaysiaMexicoMicronesiaMiddle AfricaMoroccoNepalNetherlandsNicaraguaNigeriaNorthern AfricaNorthern EuropeOceaniaPakistanPeruPhilippinesPolandPortugalRomaniaRussiaSaudi ArabiaScotlandSierra LeoneSomaliaSouth AfricaSouth AmericaSouth Central AsiaSouth Eastern AsiaSouthern EuropeSpainSri LankaSudanSwedenSwitzerlandSyriaTaiwanThailandTrinidad and TobagoTurkeyUgandaUkraineUruguayVenezuelaVietnamWestern AfricaWestern AsiaWestern EuropeZaireZimbabwe
Immigrant Origin (Percentage)
AfghanistanAfricaArgentinaAsiaAustraliaBahamasBangladeshBelarusBelgiumBelizeBoliviaBosnia and HerzegovinaBrazilBulgariaBurma / MyanmarCambodiaCameroonCanadaCaribbeanCentral AmericaChileChinaColombiaCongoCosta RicaCubaCzechoslovakiaDenmarkDominican RepublicEastern AfricaEastern AsiaEastern EuropeEcuadorEgyptEl SalvadorEnglandEritreaEthiopiaEuropeFijiFranceGermanyGhanaGreeceGuatemalaGuyanaHaitiHondurasHong KongHungaryIndiaIndonesiaIranIraqIrelandIsraelItalyJamaicaJapanJordanKazakhstanKenyaKoreaKuwaitLaosLatin AmericaLebanonLiberiaMalaysiaMexicoMicronesiaMiddle AfricaMoroccoNepalNetherlandsNicaraguaNigeriaNorthern AfricaNorthern EuropeOceaniaPakistanPeruPhilippinesPolandPortugalRomaniaRussiaSaudi ArabiaScotlandSierra LeoneSomaliaSouth AfricaSouth AmericaSouth Central AsiaSouth Eastern AsiaSouthern EuropeSpainSri LankaSudanSwedenSwitzerlandSyriaTaiwanThailandTrinidad and TobagoTurkeyUgandaUkraineUruguayVenezuelaVietnamWestern AfricaWestern AsiaWestern EuropeZaireZimbabwe
Income
Income (Families)
Income (Households)
Poverty
Poverty (Families)
Unemployment
Employment Occupations
Employment Industries
Employer Class
Commute Time
Commute Means
School Enrollment
Education by Degree Field
Occupancy
Finances
Physical Characteristics
Kansas City
Compare Zip Codes
Comparison Subject

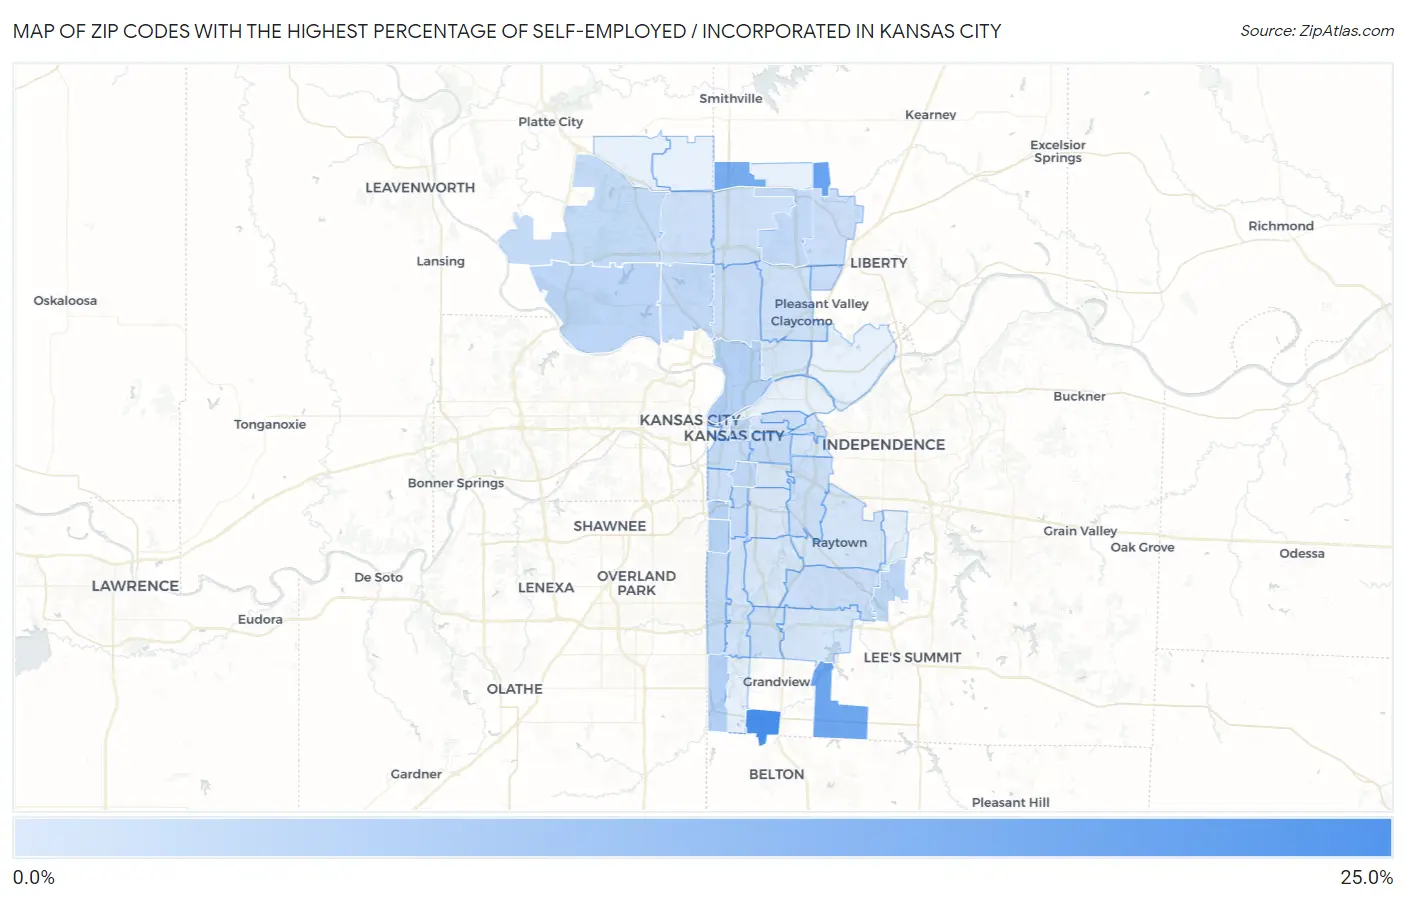
Map of Zip Codes with the Highest Percentage of Self-Employed / Incorporated in Kansas City

0.0%
25.0%
Zip Codes with the Highest Percentage of Self-Employed / Incorporated in Kansas City Map

Zip Codes with the Highest Percentage of Self-Employed / Incorporated in Kansas City, MO

Zip Code % Self-Employed / Incorporated vs State vs National
1.6414722.4%3.2%(+19.1)#73.8%(+18.5)#398
2.6416717.4%3.2%(+14.2)#153.8%(+13.6)#673
3.6414916.0%3.2%(+12.8)#213.8%(+12.2)#810
4.6416514.7%3.2%(+11.4)#283.8%(+10.8)#1,013
5.641455.9%3.2%(+2.65)#1563.8%(+2.07)#6,546
6.641165.5%3.2%(+2.29)#1773.8%(+1.71)#7,289
7.641125.4%3.2%(+2.18)#1833.8%(+1.60)#7,542
8.641135.3%3.2%(+2.08)#1903.8%(+1.50)#7,780
9.641524.6%3.2%(+1.35)#2433.8%(+0.773)#9,803
10.641394.3%3.2%(+1.11)#2623.8%(+0.531)#10,623
11.641064.2%3.2%(+0.970)#2813.8%(+0.390)#11,146
12.641514.1%3.2%(+0.862)#2943.8%(+0.283)#11,522
13.641094.1%3.2%(+0.831)#2973.8%(+0.252)#11,652
14.641563.9%3.2%(+0.709)#3123.8%(+0.130)#12,157
15.641533.9%3.2%(+0.652)#3183.8%(+0.073)#12,384
16.641143.5%3.2%(+0.266)#3683.8%(-0.314)#14,010
17.641273.5%3.2%(+0.229)#3743.8%(-0.350)#14,183
18.641083.4%3.2%(+0.211)#3783.8%(-0.368)#14,255
19.641183.2%3.2%(-0.031)#4133.8%(-0.610)#15,370
20.641583.0%3.2%(-0.218)#4303.8%(-0.798)#16,292
21.641103.0%3.2%(-0.267)#4413.8%(-0.846)#16,537
22.641572.8%3.2%(-0.452)#4673.8%(-1.03)#17,447
23.641382.6%3.2%(-0.601)#4873.8%(-1.18)#18,236
24.641292.6%3.2%(-0.644)#4963.8%(-1.22)#18,455
25.641542.6%3.2%(-0.656)#4983.8%(-1.24)#18,518
26.641232.5%3.2%(-0.782)#5213.8%(-1.36)#19,114
27.641112.3%3.2%(-0.908)#5413.8%(-1.49)#19,709
28.641372.2%3.2%(-1.02)#5623.8%(-1.60)#20,260
29.641552.2%3.2%(-1.02)#5633.8%(-1.60)#20,265
30.641192.1%3.2%(-1.16)#5873.8%(-1.74)#20,992
31.641251.9%3.2%(-1.39)#6233.8%(-1.97)#22,050
32.641311.7%3.2%(-1.56)#6443.8%(-2.14)#22,773
33.641341.4%3.2%(-1.88)#6873.8%(-2.46)#24,038
34.641261.3%3.2%(-1.92)#6943.8%(-2.50)#24,210
35.641331.3%3.2%(-1.95)#6973.8%(-2.53)#24,300
36.641241.3%3.2%(-1.98)#7013.8%(-2.56)#24,411
37.641171.2%3.2%(-2.00)#7053.8%(-2.58)#24,482
38.641320.97%3.2%(-2.27)#7423.8%(-2.84)#25,355
39.641280.89%3.2%(-2.35)#7493.8%(-2.93)#25,581
40.641300.66%3.2%(-2.58)#7683.8%(-3.16)#26,162
41.641050.31%3.2%(-2.93)#7883.8%(-3.51)#26,781

Common Questions

What are the Top 10 Zip Codes with the Highest Percentage of Self-Employed / Incorporated in Kansas City, MO?
Top 10 Zip Codes with the Highest Percentage of Self-Employed / Incorporated in Kansas City, MO are:
#1
22.4%
#2
17.4%
#3
16.0%
#4
14.7%
#5
5.9%
#6
5.5%
#7
5.4%
#8
5.3%
#9
4.6%
#10
4.3%
What zip code has the Highest Percentage of Self-Employed / Incorporated in Kansas City, MO?
64147 has the Highest Percentage of Self-Employed / Incorporated in Kansas City, MO with 22.4%.
What is the Percentage of Self-Employed / Incorporated in Kansas City, MO?
Percentage of Self-Employed / Incorporated in Kansas City is 2.8%.
What is the Percentage of Self-Employed / Incorporated in Missouri?
Percentage of Self-Employed / Incorporated in Missouri is 3.2%.
What is the Percentage of Self-Employed / Incorporated in the United States?
Percentage of Self-Employed / Incorporated in the United States is 3.8%.