Zip Codes with the Highest Percentage of Hispanic or Latino Population in Independence, MO
RELATED REPORTS & OPTIONS
Hispanic or Latino
Independence
Compare Zip Codes
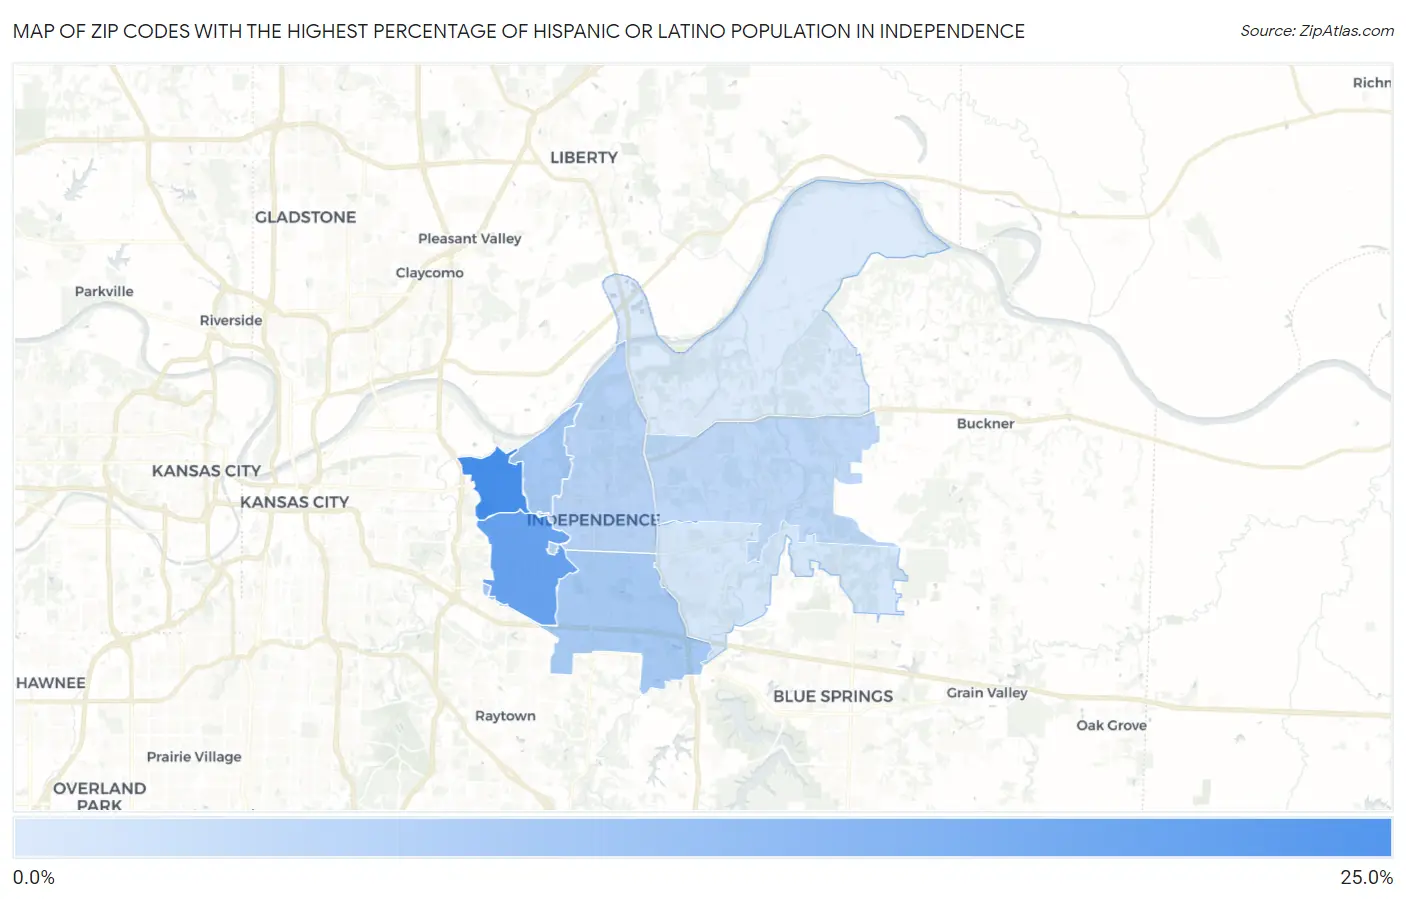
Map of Zip Codes with the Highest Percentage of Hispanic or Latino Population in Independence
2.6%
21.7%
Zip Codes with the Highest Percentage of Hispanic or Latino Population in Independence, MO
| Zip Code | Hispanic or Latino | vs State | vs National | |
| 1. | 64053 | 21.7% | 4.6%(+17.1)#19 | 18.7%(+3.02)#4,416 |
| 2. | 64052 | 17.2% | 4.6%(+12.6)#25 | 18.7%(-1.48)#5,586 |
| 3. | 64054 | 9.2% | 4.6%(+4.64)#72 | 18.7%(-9.46)#9,546 |
| 4. | 64055 | 9.0% | 4.6%(+4.40)#74 | 18.7%(-9.70)#9,712 |
| 5. | 64050 | 7.1% | 4.6%(+2.51)#112 | 18.7%(-11.6)#11,548 |
| 6. | 64056 | 6.1% | 4.6%(+1.57)#142 | 18.7%(-12.5)#12,648 |
| 7. | 64057 | 3.5% | 4.6%(-1.04)#285 | 18.7%(-15.1)#17,117 |
| 8. | 64058 | 2.6% | 4.6%(-1.95)#368 | 18.7%(-16.0)#19,398 |
1
Common Questions
What are the Top 5 Zip Codes with the Highest Percentage of Hispanic or Latino Population in Independence, MO?
Top 5 Zip Codes with the Highest Percentage of Hispanic or Latino Population in Independence, MO are:
What zip code has the Highest Percentage of Hispanic or Latino Population in Independence, MO?
64053 has the Highest Percentage of Hispanic or Latino Population in Independence, MO with 21.7%.
What is the Percentage of Hispanic or Latino Population in Independence, MO?
Percentage of Hispanic or Latino Population in Independence is 9.6%.
What is the Percentage of Hispanic or Latino Population in Missouri?
Percentage of Hispanic or Latino Population in Missouri is 4.6%.
What is the Percentage of Hispanic or Latino Population in the United States?
Percentage of Hispanic or Latino Population in the United States is 18.7%.