Zip Codes with the Highest Percentage of Self-Employed / Incorporated in Florissant, MO
RELATED REPORTS & OPTIONS
Self-Employed / Incorporated
Florissant
Compare Zip Codes
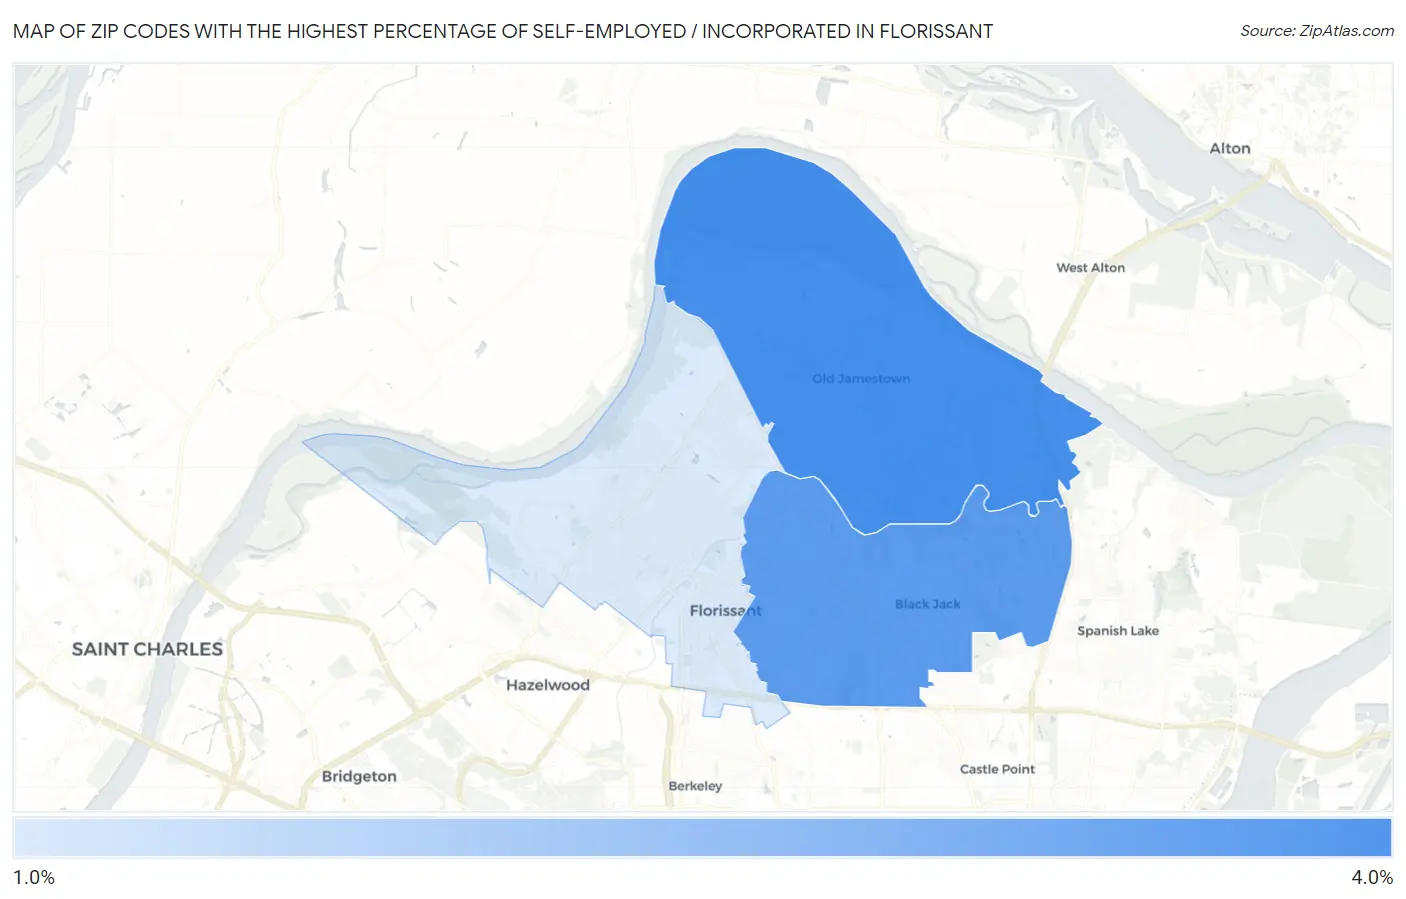
Map of Zip Codes with the Highest Percentage of Self-Employed / Incorporated in Florissant
1.5%
3.8%
Zip Codes with the Highest Percentage of Self-Employed / Incorporated in Florissant, MO
| Zip Code | % Self-Employed / Incorporated | vs State | vs National | |
| 1. | 63034 | 3.8% | 3.2%(+0.573)#328 | 3.8%(-0.006)#12,715 |
| 2. | 63033 | 3.5% | 3.2%(+0.288)#363 | 3.8%(-0.291)#13,910 |
| 3. | 63031 | 1.5% | 3.2%(-1.71)#662 | 3.8%(-2.29)#23,380 |
1
Common Questions
What are the Top Zip Codes with the Highest Percentage of Self-Employed / Incorporated in Florissant, MO?
Top Zip Codes with the Highest Percentage of Self-Employed / Incorporated in Florissant, MO are:
What zip code has the Highest Percentage of Self-Employed / Incorporated in Florissant, MO?
63034 has the Highest Percentage of Self-Employed / Incorporated in Florissant, MO with 3.8%.
What is the Percentage of Self-Employed / Incorporated in Florissant, MO?
Percentage of Self-Employed / Incorporated in Florissant is 2.9%.
What is the Percentage of Self-Employed / Incorporated in Missouri?
Percentage of Self-Employed / Incorporated in Missouri is 3.2%.
What is the Percentage of Self-Employed / Incorporated in the United States?
Percentage of Self-Employed / Incorporated in the United States is 3.8%.