Zip Codes with the Highest Percentage of White / Caucasian Population in Blue Springs, MO
RELATED REPORTS & OPTIONS
White / Caucasian
Blue Springs
Compare Zip Codes
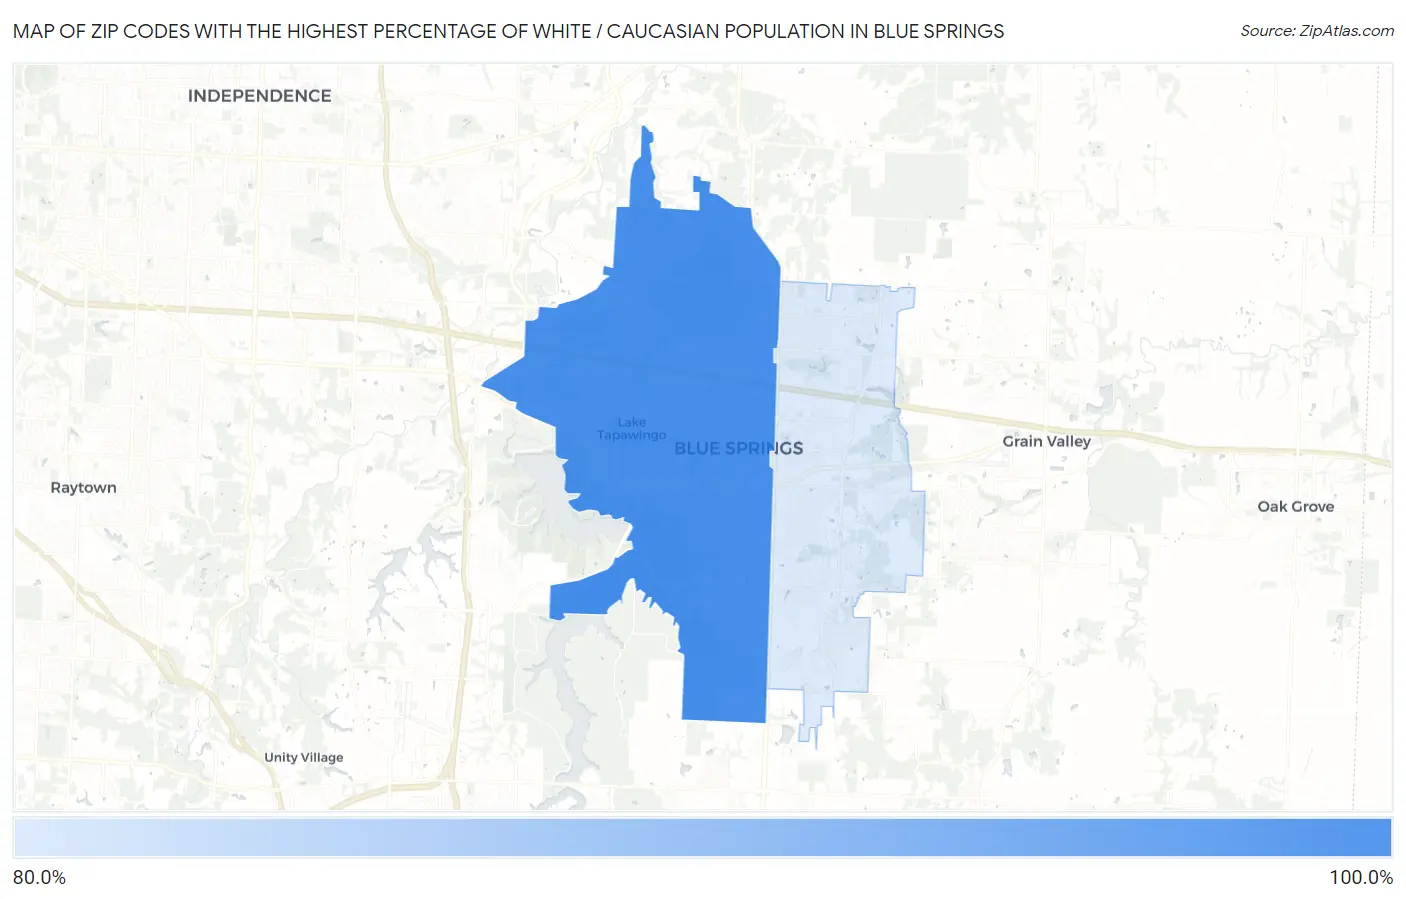
Map of Zip Codes with the Highest Percentage of White / Caucasian Population in Blue Springs
83.5%
85.4%
Zip Codes with the Highest Percentage of White / Caucasian Population in Blue Springs, MO
| Zip Code | White / Caucasian | vs State | vs National | |
| 1. | 64015 | 85.4% | 79.4%(+6.09)#806 | 65.9%(+19.6)#18,120 |
| 2. | 64014 | 83.5% | 79.4%(+4.13)#837 | 65.9%(+17.6)#19,230 |
1
Common Questions
What are the Top Zip Codes with the Highest Percentage of White / Caucasian Population in Blue Springs, MO?
Top Zip Codes with the Highest Percentage of White / Caucasian Population in Blue Springs, MO are:
What zip code has the Highest Percentage of White / Caucasian Population in Blue Springs, MO?
64015 has the Highest Percentage of White / Caucasian Population in Blue Springs, MO with 85.4%.
What is the Percentage of White / Caucasian Population in Blue Springs, MO?
Percentage of White / Caucasian Population in Blue Springs is 84.6%.
What is the Percentage of White / Caucasian Population in Missouri?
Percentage of White / Caucasian Population in Missouri is 79.4%.
What is the Percentage of White / Caucasian Population in the United States?
Percentage of White / Caucasian Population in the United States is 65.9%.