Zip Codes with the Highest Percentage of Population Employed in Construction & Extraction in Minnesota
RELATED REPORTS & OPTIONS
Construction & Extraction
Minnesota
Compare Zip Codes
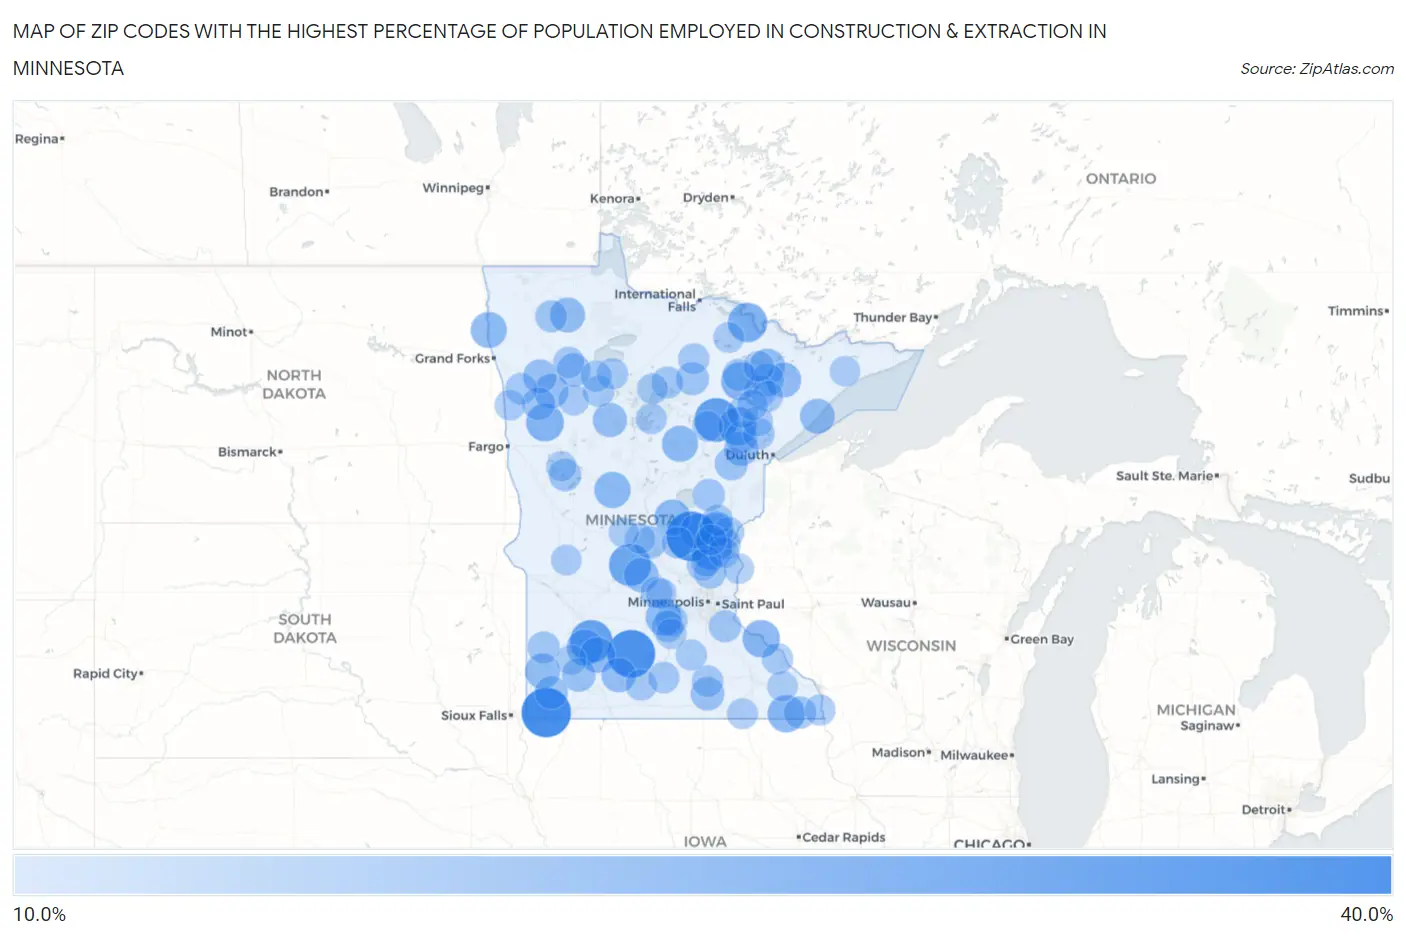
Map of Zip Codes with the Highest Percentage of Population Employed in Construction & Extraction in Minnesota
10.0%
40.0%
Zip Codes with the Highest Percentage of Population Employed in Construction & Extraction in Minnesota
| Zip Code | % Employed | vs State | vs National | |
| 1. | 56313 | 30.4% | 4.4%(+26.1)#1 | 5.0%(+25.4)#389 |
| 2. | 56146 | 30.3% | 4.4%(+25.9)#2 | 5.0%(+25.3)#393 |
| 3. | 56030 | 28.6% | 4.4%(+24.2)#3 | 5.0%(+23.6)#442 |
| 4. | 55742 | 24.4% | 4.4%(+20.0)#4 | 5.0%(+19.4)#625 |
| 5. | 56287 | 23.3% | 4.4%(+18.9)#5 | 5.0%(+18.3)#703 |
| 6. | 56371 | 22.6% | 4.4%(+18.3)#6 | 5.0%(+17.6)#742 |
| 7. | 55029 | 22.2% | 4.4%(+17.8)#7 | 5.0%(+17.2)#777 |
| 8. | 55725 | 20.0% | 4.4%(+15.6)#8 | 5.0%(+15.0)#1,002 |
| 9. | 55765 | 18.7% | 4.4%(+14.4)#9 | 5.0%(+13.7)#1,175 |
| 10. | 56541 | 18.5% | 4.4%(+14.1)#10 | 5.0%(+13.5)#1,213 |
| 11. | 55710 | 18.3% | 4.4%(+14.0)#11 | 5.0%(+13.3)#1,243 |
| 12. | 55026 | 18.0% | 4.4%(+13.6)#12 | 5.0%(+13.0)#1,303 |
| 13. | 55922 | 17.9% | 4.4%(+13.6)#13 | 5.0%(+12.9)#1,308 |
| 14. | 56255 | 17.1% | 4.4%(+12.7)#14 | 5.0%(+12.1)#1,450 |
| 15. | 56434 | 16.9% | 4.4%(+12.5)#15 | 5.0%(+11.9)#1,501 |
| 16. | 55370 | 16.7% | 4.4%(+12.3)#16 | 5.0%(+11.7)#1,527 |
| 17. | 56338 | 16.7% | 4.4%(+12.3)#17 | 5.0%(+11.7)#1,532 |
| 18. | 56744 | 16.7% | 4.4%(+12.3)#18 | 5.0%(+11.7)#1,541 |
| 19. | 55785 | 16.7% | 4.4%(+12.3)#19 | 5.0%(+11.7)#1,545 |
| 20. | 56294 | 16.4% | 4.4%(+12.0)#20 | 5.0%(+11.4)#1,625 |
| 21. | 56358 | 16.0% | 4.4%(+11.6)#21 | 5.0%(+11.0)#1,726 |
| 22. | 56139 | 15.7% | 4.4%(+11.4)#22 | 5.0%(+10.8)#1,783 |
| 23. | 55782 | 15.7% | 4.4%(+11.3)#23 | 5.0%(+10.7)#1,796 |
| 24. | 55706 | 15.6% | 4.4%(+11.2)#24 | 5.0%(+10.6)#1,828 |
| 25. | 56724 | 15.6% | 4.4%(+11.2)#25 | 5.0%(+10.6)#1,836 |
| 26. | 55601 | 15.5% | 4.4%(+11.1)#26 | 5.0%(+10.5)#1,856 |
| 27. | 55036 | 15.4% | 4.4%(+11.0)#27 | 5.0%(+10.4)#1,887 |
| 28. | 56022 | 15.2% | 4.4%(+10.8)#28 | 5.0%(+10.2)#1,946 |
| 29. | 56592 | 15.2% | 4.4%(+10.8)#29 | 5.0%(+10.2)#1,968 |
| 30. | 55389 | 15.1% | 4.4%(+10.7)#30 | 5.0%(+10.1)#1,978 |
| 31. | 56458 | 14.9% | 4.4%(+10.5)#31 | 5.0%(+9.90)#2,067 |
| 32. | 55711 | 14.9% | 4.4%(+10.5)#32 | 5.0%(+9.89)#2,072 |
| 33. | 56736 | 14.6% | 4.4%(+10.2)#33 | 5.0%(+9.57)#2,214 |
| 34. | 56125 | 14.3% | 4.4%(+9.90)#34 | 5.0%(+9.29)#2,336 |
| 35. | 56035 | 14.2% | 4.4%(+9.84)#35 | 5.0%(+9.22)#2,358 |
| 36. | 55030 | 14.2% | 4.4%(+9.80)#36 | 5.0%(+9.19)#2,370 |
| 37. | 56646 | 14.1% | 4.4%(+9.71)#37 | 5.0%(+9.10)#2,413 |
| 38. | 55732 | 13.7% | 4.4%(+9.34)#38 | 5.0%(+8.73)#2,578 |
| 39. | 56153 | 13.7% | 4.4%(+9.34)#39 | 5.0%(+8.73)#2,583 |
| 40. | 56628 | 13.7% | 4.4%(+9.28)#40 | 5.0%(+8.66)#2,626 |
| 41. | 55726 | 13.6% | 4.4%(+9.25)#41 | 5.0%(+8.63)#2,643 |
| 42. | 56545 | 13.5% | 4.4%(+9.12)#42 | 5.0%(+8.51)#2,707 |
| 43. | 56375 | 13.3% | 4.4%(+8.91)#43 | 5.0%(+8.30)#2,800 |
| 44. | 56528 | 13.1% | 4.4%(+8.76)#44 | 5.0%(+8.15)#2,865 |
| 45. | 55708 | 13.1% | 4.4%(+8.71)#45 | 5.0%(+8.10)#2,881 |
| 46. | 55011 | 13.0% | 4.4%(+8.60)#46 | 5.0%(+7.98)#2,948 |
| 47. | 56113 | 12.9% | 4.4%(+8.52)#47 | 5.0%(+7.91)#2,991 |
| 48. | 55974 | 12.9% | 4.4%(+8.48)#48 | 5.0%(+7.87)#3,012 |
| 49. | 55085 | 12.8% | 4.4%(+8.46)#49 | 5.0%(+7.85)#3,021 |
| 50. | 56350 | 12.8% | 4.4%(+8.44)#50 | 5.0%(+7.83)#3,034 |
| 51. | 55368 | 12.8% | 4.4%(+8.42)#51 | 5.0%(+7.81)#3,048 |
| 52. | 55703 | 12.8% | 4.4%(+8.42)#52 | 5.0%(+7.80)#3,050 |
| 53. | 56737 | 12.7% | 4.4%(+8.36)#53 | 5.0%(+7.75)#3,084 |
| 54. | 55321 | 12.7% | 4.4%(+8.32)#54 | 5.0%(+7.70)#3,119 |
| 55. | 55702 | 12.6% | 4.4%(+8.18)#55 | 5.0%(+7.57)#3,210 |
| 56. | 55717 | 12.5% | 4.4%(+8.12)#56 | 5.0%(+7.51)#3,262 |
| 57. | 56680 | 12.5% | 4.4%(+8.12)#57 | 5.0%(+7.51)#3,270 |
| 58. | 56357 | 12.4% | 4.4%(+8.05)#58 | 5.0%(+7.44)#3,319 |
| 59. | 55338 | 12.4% | 4.4%(+8.00)#59 | 5.0%(+7.39)#3,353 |
| 60. | 56517 | 12.3% | 4.4%(+7.95)#60 | 5.0%(+7.33)#3,386 |
| 61. | 56046 | 12.3% | 4.4%(+7.93)#61 | 5.0%(+7.31)#3,396 |
| 62. | 55070 | 12.2% | 4.4%(+7.82)#62 | 5.0%(+7.21)#3,456 |
| 63. | 56060 | 12.2% | 4.4%(+7.81)#63 | 5.0%(+7.20)#3,460 |
| 64. | 56684 | 12.1% | 4.4%(+7.76)#64 | 5.0%(+7.14)#3,503 |
| 65. | 56676 | 12.1% | 4.4%(+7.75)#65 | 5.0%(+7.14)#3,507 |
| 66. | 56037 | 12.1% | 4.4%(+7.70)#66 | 5.0%(+7.09)#3,540 |
| 67. | 56667 | 12.1% | 4.4%(+7.68)#67 | 5.0%(+7.06)#3,551 |
| 68. | 56652 | 12.0% | 4.4%(+7.65)#68 | 5.0%(+7.04)#3,568 |
| 69. | 55069 | 12.0% | 4.4%(+7.64)#69 | 5.0%(+7.02)#3,575 |
| 70. | 55705 | 11.9% | 4.4%(+7.51)#70 | 5.0%(+6.90)#3,653 |
| 71. | 55945 | 11.9% | 4.4%(+7.48)#71 | 5.0%(+6.87)#3,672 |
| 72. | 56639 | 11.8% | 4.4%(+7.38)#72 | 5.0%(+6.77)#3,742 |
| 73. | 55919 | 11.7% | 4.4%(+7.33)#73 | 5.0%(+6.72)#3,797 |
| 74. | 56052 | 11.7% | 4.4%(+7.32)#74 | 5.0%(+6.70)#3,811 |
| 75. | 55063 | 11.7% | 4.4%(+7.30)#75 | 5.0%(+6.68)#3,826 |
| 76. | 56641 | 11.7% | 4.4%(+7.29)#76 | 5.0%(+6.67)#3,840 |
| 77. | 56681 | 11.7% | 4.4%(+7.27)#77 | 5.0%(+6.66)#3,852 |
| 78. | 55040 | 11.6% | 4.4%(+7.26)#78 | 5.0%(+6.65)#3,858 |
| 79. | 55007 | 11.6% | 4.4%(+7.25)#79 | 5.0%(+6.63)#3,869 |
| 80. | 55738 | 11.6% | 4.4%(+7.18)#80 | 5.0%(+6.57)#3,914 |
| 81. | 55790 | 11.6% | 4.4%(+7.18)#81 | 5.0%(+6.57)#3,916 |
| 82. | 55771 | 11.5% | 4.4%(+7.14)#82 | 5.0%(+6.52)#3,945 |
| 83. | 55977 | 11.5% | 4.4%(+7.11)#83 | 5.0%(+6.50)#3,963 |
| 84. | 55032 | 11.4% | 4.4%(+7.05)#84 | 5.0%(+6.44)#4,012 |
| 85. | 56651 | 11.4% | 4.4%(+7.05)#85 | 5.0%(+6.43)#4,014 |
| 86. | 55006 | 11.4% | 4.4%(+7.01)#86 | 5.0%(+6.40)#4,038 |
| 87. | 55724 | 11.4% | 4.4%(+6.98)#87 | 5.0%(+6.36)#4,061 |
| 88. | 56548 | 11.4% | 4.4%(+6.98)#88 | 5.0%(+6.36)#4,062 |
| 89. | 55793 | 11.3% | 4.4%(+6.96)#89 | 5.0%(+6.34)#4,081 |
| 90. | 56244 | 11.3% | 4.4%(+6.94)#90 | 5.0%(+6.33)#4,090 |
| 91. | 55734 | 11.3% | 4.4%(+6.89)#91 | 5.0%(+6.28)#4,133 |
| 92. | 55349 | 11.2% | 4.4%(+6.86)#92 | 5.0%(+6.25)#4,158 |
| 93. | 55074 | 11.2% | 4.4%(+6.82)#93 | 5.0%(+6.20)#4,191 |
| 94. | 56044 | 11.2% | 4.4%(+6.79)#94 | 5.0%(+6.18)#4,223 |
| 95. | 55615 | 11.1% | 4.4%(+6.73)#95 | 5.0%(+6.12)#4,276 |
| 96. | 55979 | 11.1% | 4.4%(+6.71)#96 | 5.0%(+6.09)#4,301 |
| 97. | 56340 | 11.1% | 4.4%(+6.71)#97 | 5.0%(+6.09)#4,302 |
| 98. | 56175 | 11.0% | 4.4%(+6.65)#98 | 5.0%(+6.04)#4,338 |
| 99. | 56587 | 11.0% | 4.4%(+6.63)#99 | 5.0%(+6.02)#4,356 |
| 100. | 56336 | 11.0% | 4.4%(+6.60)#100 | 5.0%(+5.99)#4,382 |
Common Questions
What are the Top 10 Zip Codes with the Highest Percentage of Population Employed in Construction & Extraction in Minnesota?
Top 10 Zip Codes with the Highest Percentage of Population Employed in Construction & Extraction in Minnesota are:
What zip code has the Highest Percentage of Population Employed in Construction & Extraction in Minnesota?
56313 has the Highest Percentage of Population Employed in Construction & Extraction in Minnesota with 30.4%.
What is the Percentage of Population Employed in Construction & Extraction in the State of Minnesota?
Percentage of Population Employed in Construction & Extraction in Minnesota is 4.4%.
What is the Percentage of Population Employed in Construction & Extraction in the United States?
Percentage of Population Employed in Construction & Extraction in the United States is 5.0%.