Zip Codes with the Highest Percentage of Self-Employed / Incorporated in Saint Paul, MN

RELATED REPORTS & OPTIONS

Self-Employed / Incorporated
Population
Families and Households
Female Fertility
Female Fertility (Unmarried)
Race (Community Size)
Race (Percentage)
Ancestry (Community Size)
AfghanAfricanAlbanianAlsatianAmericanApacheArabArgentineanArmenianAustralianAustrianBahamianBangladeshiBarbadianBelgianBelizeanBhutaneseBlackfeetBrazilianBritishBritish West IndianBulgarianBurmeseCambodianCanadianCarpatho RusynCelticCentral AmericanCentral American IndianCherokeeChickasawChileanChippewaChoctawColombianCosta RicanCreeCroatianCubanCzechCzechoslovakianDanishDominicanDutchEastern EuropeanEcuadorianEgyptianEnglishEstonianEthiopianEuropeanFilipinoFinnishFrenchFrench American IndianFrench CanadianGermanGerman RussianGhanaianGreekGuamanian / ChamorroGuatemalanGuyaneseHaitianHonduranHopiHungarianIcelanderIndian (Asian)IndonesianInupiatIranianIraqiIrishIroquoisIsraeliItalianJamaicanJapaneseJordanianKenyanKoreanLaotianLatvianLebaneseLiberianLithuanianLuxembourgerMacedonianMalaysianMalteseMenomineeMexicanMexican American IndianMongolianMoroccanNative HawaiianNavajoNew ZealanderNicaraguanNigerianNorthern EuropeanNorwegianPakistaniPalestinianPanamanianParaguayanPennsylvania GermanPeruvianPolishPortuguesePotawatomiPuerto RicanPuget Sound SalishRomanianRussianSalvadoranSamoanScandinavianScotch-IrishScottishSeminoleSerbianSiouxSlavicSlovakSloveneSomaliSouth AfricanSouth AmericanSouth American IndianSpaniardSpanishSpanish AmericanSri LankanSubsaharan AfricanSudaneseSwedishSwissSyrianThaiTrinidadian and TobagonianTurkishU.S. Virgin IslanderUgandanUkrainianUruguayanVenezuelanVietnameseWelshWest IndianYugoslavianZimbabwean
Ancestry (Percentage)
AfghanAfricanAlbanianAlsatianAmericanApacheArabArgentineanArmenianAustralianAustrianBahamianBangladeshiBarbadianBelgianBelizeanBhutaneseBlackfeetBrazilianBritishBritish West IndianBulgarianBurmeseCambodianCanadianCarpatho RusynCelticCentral AmericanCentral American IndianCherokeeChickasawChileanChippewaChoctawColombianCosta RicanCreeCroatianCubanCzechCzechoslovakianDanishDominicanDutchEastern EuropeanEcuadorianEgyptianEnglishEstonianEthiopianEuropeanFilipinoFinnishFrenchFrench American IndianFrench CanadianGermanGerman RussianGhanaianGreekGuamanian / ChamorroGuatemalanGuyaneseHaitianHonduranHopiHungarianIcelanderIndian (Asian)IndonesianInupiatIranianIraqiIrishIroquoisIsraeliItalianJamaicanJapaneseJordanianKenyanKoreanLaotianLatvianLebaneseLiberianLithuanianLuxembourgerMacedonianMalaysianMalteseMenomineeMexicanMexican American IndianMongolianMoroccanNative HawaiianNavajoNew ZealanderNicaraguanNigerianNorthern EuropeanNorwegianPakistaniPalestinianPanamanianParaguayanPennsylvania GermanPeruvianPolishPortuguesePotawatomiPuerto RicanPuget Sound SalishRomanianRussianSalvadoranSamoanScandinavianScotch-IrishScottishSeminoleSerbianSiouxSlavicSlovakSloveneSomaliSouth AfricanSouth AmericanSouth American IndianSpaniardSpanishSpanish AmericanSri LankanSubsaharan AfricanSudaneseSwedishSwissSyrianThaiTrinidadian and TobagonianTurkishU.S. Virgin IslanderUgandanUkrainianUruguayanVenezuelanVietnameseWelshWest IndianYugoslavianZimbabwean
Immigrant Origin (Total)
AfghanistanAfricaArgentinaArmeniaAsiaAustraliaAustriaBahamasBangladeshBarbadosBelarusBelgiumBelizeBoliviaBosnia and HerzegovinaBrazilBulgariaBurma / MyanmarCambodiaCameroonCanadaCaribbeanCentral AmericaChileChinaColombiaCongoCosta RicaCroatiaCubaCzechoslovakiaDenmarkDominican RepublicEastern AfricaEastern AsiaEastern EuropeEcuadorEgyptEl SalvadorEnglandEritreaEthiopiaEuropeFranceGermanyGhanaGreeceGuatemalaGuyanaHaitiHondurasHong KongHungaryIndiaIndonesiaIranIraqIrelandIsraelItalyJamaicaJapanJordanKazakhstanKenyaKoreaKuwaitLaosLatin AmericaLatviaLebanonLiberiaMalaysiaMexicoMiddle AfricaMoldovaMoroccoNepalNetherlandsNicaraguaNigeriaNorth MacedoniaNorthern AfricaNorthern EuropeNorwayOceaniaPakistanPanamaPeruPhilippinesPolandPortugalRomaniaRussiaSaudi ArabiaScotlandSerbiaSierra LeoneSingaporeSomaliaSouth AfricaSouth AmericaSouth Central AsiaSouth Eastern AsiaSouthern EuropeSpainSri LankaSudanSwedenSwitzerlandTaiwanThailandTrinidad and TobagoTurkeyUgandaUkraineUruguayVenezuelaVietnamWestern AfricaWestern AsiaWestern EuropeYemenZaireZimbabwe
Immigrant Origin (Percentage)
AfghanistanAfricaArgentinaArmeniaAsiaAustraliaAustriaBahamasBangladeshBarbadosBelarusBelgiumBelizeBoliviaBosnia and HerzegovinaBrazilBulgariaBurma / MyanmarCambodiaCameroonCanadaCaribbeanCentral AmericaChileChinaColombiaCongoCosta RicaCroatiaCubaCzechoslovakiaDenmarkDominican RepublicEastern AfricaEastern AsiaEastern EuropeEcuadorEgyptEl SalvadorEnglandEritreaEthiopiaEuropeFranceGermanyGhanaGreeceGuatemalaGuyanaHaitiHondurasHong KongHungaryIndiaIndonesiaIranIraqIrelandIsraelItalyJamaicaJapanJordanKazakhstanKenyaKoreaKuwaitLaosLatin AmericaLatviaLebanonLiberiaMalaysiaMexicoMiddle AfricaMoldovaMoroccoNepalNetherlandsNicaraguaNigeriaNorth MacedoniaNorthern AfricaNorthern EuropeNorwayOceaniaPakistanPanamaPeruPhilippinesPolandPortugalRomaniaRussiaSaudi ArabiaScotlandSerbiaSierra LeoneSingaporeSomaliaSouth AfricaSouth AmericaSouth Central AsiaSouth Eastern AsiaSouthern EuropeSpainSri LankaSudanSwedenSwitzerlandTaiwanThailandTrinidad and TobagoTurkeyUgandaUkraineUruguayVenezuelaVietnamWestern AfricaWestern AsiaWestern EuropeYemenZaireZimbabwe
Income
Income (Families)
Income (Households)
Poverty
Poverty (Families)
Unemployment
Employment Occupations
Employment Industries
Employer Class
Commute Time
Commute Means
School Enrollment
Education by Degree Field
Occupancy
Finances
Physical Characteristics
Saint Paul
Compare Zip Codes
Comparison Subject

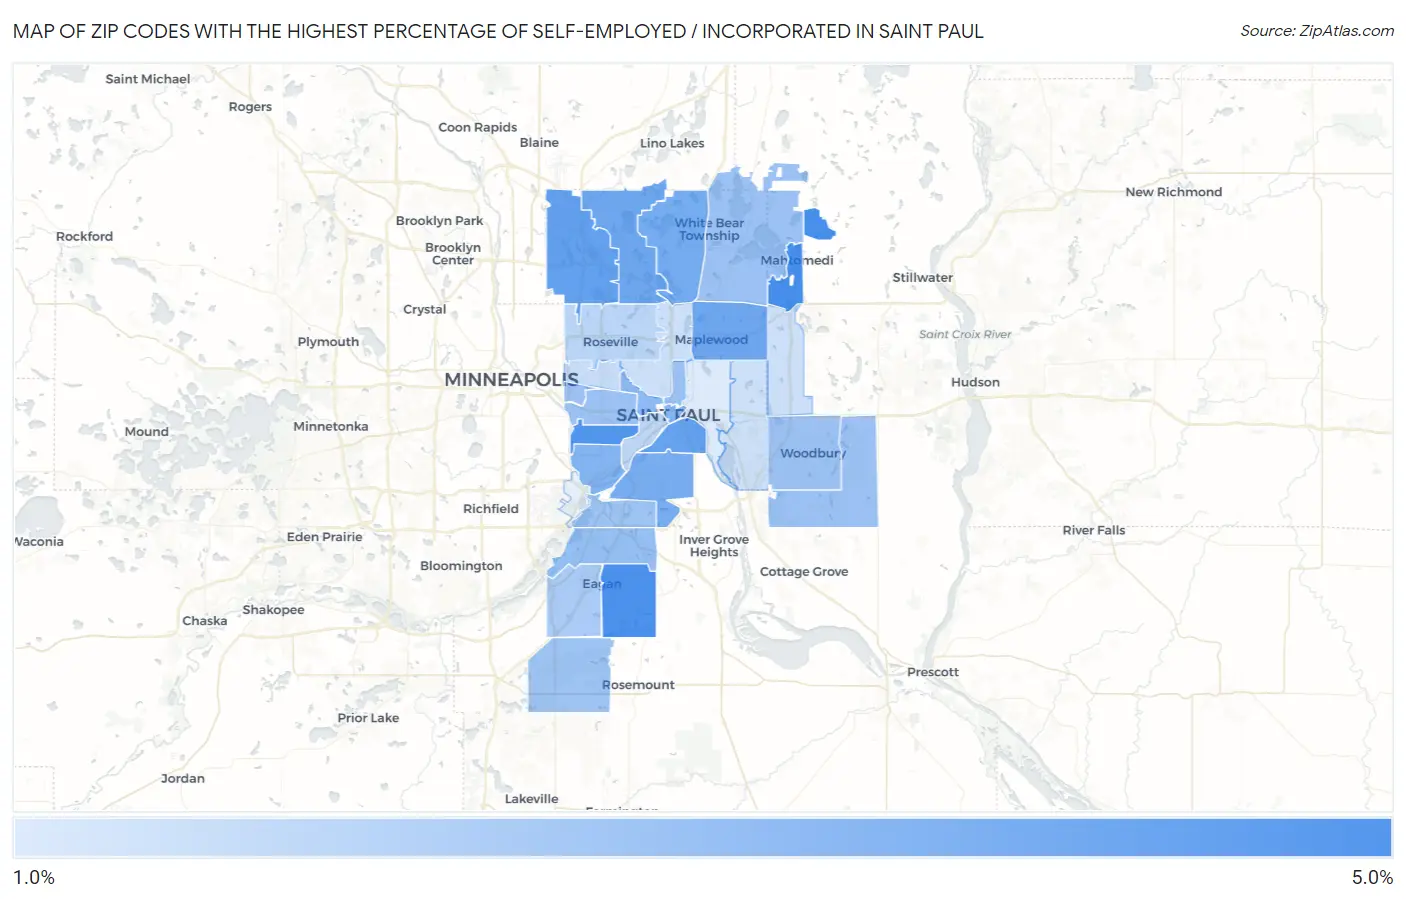
Map of Zip Codes with the Highest Percentage of Self-Employed / Incorporated in Saint Paul

0.0%
5.0%
Zip Codes with the Highest Percentage of Self-Employed / Incorporated in Saint Paul Map

Zip Codes with the Highest Percentage of Self-Employed / Incorporated in Saint Paul, MN

Zip Code % Self-Employed / Incorporated vs State vs National
1.551154.9%3.9%(+0.995)#3033.8%(+1.10)#8,831
2.551234.8%3.9%(+0.918)#3093.8%(+1.02)#9,066
3.551054.7%3.9%(+0.769)#3303.8%(+0.873)#9,511
4.551124.3%3.9%(+0.424)#3743.8%(+0.527)#10,648
5.551074.3%3.9%(+0.393)#3813.8%(+0.496)#10,762
6.551264.1%3.9%(+0.211)#4173.8%(+0.314)#11,406
7.551094.1%3.9%(+0.176)#4273.8%(+0.279)#11,536
8.551274.0%3.9%(+0.036)#4503.8%(+0.139)#12,094
9.551183.9%3.9%(+0.009)#4593.8%(+0.112)#12,227
10.551163.7%3.9%(-0.230)#4953.8%(-0.126)#13,230
11.551013.6%3.9%(-0.305)#5073.8%(-0.202)#13,543
12.551033.5%3.9%(-0.456)#5273.8%(-0.353)#14,196
13.551213.3%3.9%(-0.601)#5493.8%(-0.498)#14,864
14.551103.2%3.9%(-0.689)#5643.8%(-0.586)#15,249
15.551293.2%3.9%(-0.692)#5653.8%(-0.588)#15,259
16.551303.2%3.9%(-0.707)#5683.8%(-0.604)#15,339
17.551253.2%3.9%(-0.721)#5693.8%(-0.617)#15,402
18.551143.2%3.9%(-0.726)#5703.8%(-0.623)#15,430
19.551043.2%3.9%(-0.759)#5773.8%(-0.655)#15,583
20.551243.1%3.9%(-0.777)#5843.8%(-0.673)#15,678
21.551203.1%3.9%(-0.810)#5893.8%(-0.707)#15,838
22.551222.9%3.9%(-1.03)#6263.8%(-0.924)#16,935
23.551132.6%3.9%(-1.35)#6733.8%(-1.25)#18,577
24.551022.5%3.9%(-1.42)#6843.8%(-1.32)#18,897
25.551082.3%3.9%(-1.66)#7183.8%(-1.56)#20,052
26.551282.2%3.9%(-1.74)#7293.8%(-1.64)#20,499
27.551172.2%3.9%(-1.75)#7303.8%(-1.65)#20,551
28.551192.2%3.9%(-1.76)#7313.8%(-1.66)#20,599
29.551061.9%3.9%(-2.05)#7643.8%(-1.95)#21,978

Common Questions

What are the Top 10 Zip Codes with the Highest Percentage of Self-Employed / Incorporated in Saint Paul, MN?
Top 10 Zip Codes with the Highest Percentage of Self-Employed / Incorporated in Saint Paul, MN are:
#1
4.9%
#2
4.8%
#3
4.7%
#4
4.3%
#5
4.3%
#6
4.1%
#7
4.1%
#8
4.0%
#9
3.9%
#10
3.7%
What zip code has the Highest Percentage of Self-Employed / Incorporated in Saint Paul, MN?
55115 has the Highest Percentage of Self-Employed / Incorporated in Saint Paul, MN with 4.9%.
What is the Percentage of Self-Employed / Incorporated in Minnesota?
Percentage of Self-Employed / Incorporated in Minnesota is 3.9%.
What is the Percentage of Self-Employed / Incorporated in the United States?
Percentage of Self-Employed / Incorporated in the United States is 3.8%.