Zip Codes with the Highest Percentage of Population Employed in Farming, Fishing & Forestry in Minneapolis, MN
RELATED REPORTS & OPTIONS
Farming, Fishing & Forestry
Minneapolis
Compare Zip Codes
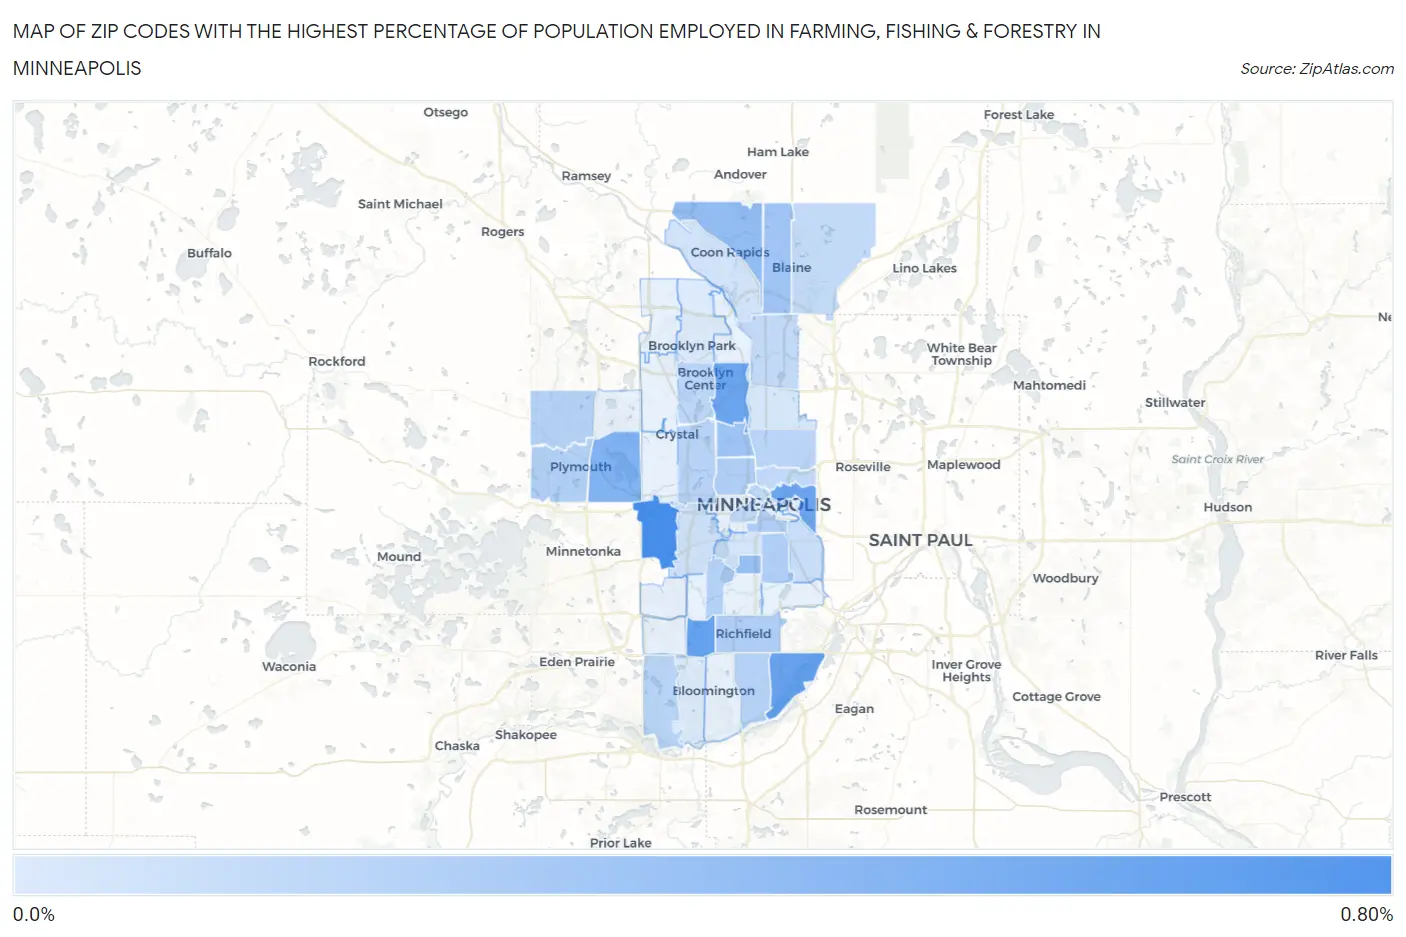
Map of Zip Codes with the Highest Percentage of Population Employed in Farming, Fishing & Forestry in Minneapolis
0.0%
0.80%
Zip Codes with the Highest Percentage of Population Employed in Farming, Fishing & Forestry in Minneapolis, MN
| Zip Code | % Employed | vs State | vs National | |
| 1. | 55426 | 0.73% | 0.63%(+0.102)#484 | 0.61%(+0.125)#11,207 |
| 2. | 55435 | 0.59% | 0.63%(-0.042)#515 | 0.61%(-0.019)#12,150 |
| 3. | 55425 | 0.58% | 0.63%(-0.045)#519 | 0.61%(-0.022)#12,176 |
| 4. | 55430 | 0.56% | 0.63%(-0.065)#527 | 0.61%(-0.042)#12,353 |
| 5. | 55414 | 0.55% | 0.63%(-0.074)#528 | 0.61%(-0.052)#12,426 |
| 6. | 55441 | 0.47% | 0.63%(-0.161)#550 | 0.61%(-0.139)#13,130 |
| 7. | 55448 | 0.38% | 0.63%(-0.248)#579 | 0.61%(-0.226)#13,949 |
| 8. | 55409 | 0.37% | 0.63%(-0.260)#583 | 0.61%(-0.238)#14,073 |
| 9. | 55412 | 0.32% | 0.63%(-0.305)#598 | 0.61%(-0.282)#14,551 |
| 10. | 55434 | 0.32% | 0.63%(-0.313)#602 | 0.61%(-0.290)#14,652 |
| 11. | 55411 | 0.25% | 0.63%(-0.378)#620 | 0.61%(-0.356)#15,416 |
| 12. | 55404 | 0.25% | 0.63%(-0.382)#622 | 0.61%(-0.359)#15,472 |
| 13. | 55423 | 0.25% | 0.63%(-0.383)#623 | 0.61%(-0.360)#15,477 |
| 14. | 55407 | 0.24% | 0.63%(-0.391)#625 | 0.61%(-0.368)#15,582 |
| 15. | 55447 | 0.23% | 0.63%(-0.398)#630 | 0.61%(-0.376)#15,698 |
| 16. | 55420 | 0.21% | 0.63%(-0.413)#636 | 0.61%(-0.391)#15,928 |
| 17. | 55410 | 0.21% | 0.63%(-0.416)#640 | 0.61%(-0.394)#15,963 |
| 18. | 55446 | 0.21% | 0.63%(-0.417)#641 | 0.61%(-0.395)#15,981 |
| 19. | 55422 | 0.20% | 0.63%(-0.425)#645 | 0.61%(-0.403)#16,093 |
| 20. | 55438 | 0.20% | 0.63%(-0.429)#647 | 0.61%(-0.407)#16,148 |
| 21. | 55418 | 0.19% | 0.63%(-0.438)#653 | 0.61%(-0.416)#16,283 |
| 22. | 55429 | 0.18% | 0.63%(-0.443)#657 | 0.61%(-0.421)#16,351 |
| 23. | 55403 | 0.16% | 0.63%(-0.465)#665 | 0.61%(-0.442)#16,692 |
| 24. | 55413 | 0.16% | 0.63%(-0.465)#666 | 0.61%(-0.443)#16,705 |
| 25. | 55432 | 0.16% | 0.63%(-0.468)#667 | 0.61%(-0.445)#16,740 |
| 26. | 55401 | 0.16% | 0.63%(-0.471)#668 | 0.61%(-0.449)#16,807 |
| 27. | 55449 | 0.15% | 0.63%(-0.480)#676 | 0.61%(-0.458)#16,954 |
| 28. | 55406 | 0.13% | 0.63%(-0.501)#682 | 0.61%(-0.479)#17,322 |
| 29. | 55416 | 0.10% | 0.63%(-0.527)#687 | 0.61%(-0.504)#17,741 |
| 30. | 55433 | 0.092% | 0.63%(-0.536)#688 | 0.61%(-0.513)#17,888 |
| 31. | 55408 | 0.072% | 0.63%(-0.556)#697 | 0.61%(-0.533)#18,260 |
| 32. | 55421 | 0.067% | 0.63%(-0.561)#700 | 0.61%(-0.538)#18,350 |
| 33. | 55437 | 0.036% | 0.63%(-0.592)#708 | 0.61%(-0.570)#18,880 |
| 34. | 55443 | 0.034% | 0.63%(-0.594)#710 | 0.61%(-0.572)#18,913 |
1
Common Questions
What are the Top 10 Zip Codes with the Highest Percentage of Population Employed in Farming, Fishing & Forestry in Minneapolis, MN?
Top 10 Zip Codes with the Highest Percentage of Population Employed in Farming, Fishing & Forestry in Minneapolis, MN are:
What zip code has the Highest Percentage of Population Employed in Farming, Fishing & Forestry in Minneapolis, MN?
55426 has the Highest Percentage of Population Employed in Farming, Fishing & Forestry in Minneapolis, MN with 0.73%.
What is the Percentage of Population Employed in Farming, Fishing & Forestry in Minneapolis, MN?
Percentage of Population Employed in Farming, Fishing & Forestry in Minneapolis is 0.19%.
What is the Percentage of Population Employed in Farming, Fishing & Forestry in Minnesota?
Percentage of Population Employed in Farming, Fishing & Forestry in Minnesota is 0.63%.
What is the Percentage of Population Employed in Farming, Fishing & Forestry in the United States?
Percentage of Population Employed in Farming, Fishing & Forestry in the United States is 0.61%.