Zip Codes with the Highest Percentage of Population Employed in Arts, Entertainment & Recreation in Hopkins, MN
RELATED REPORTS & OPTIONS
Arts, Entertainment & Recreation
Hopkins
Compare Zip Codes
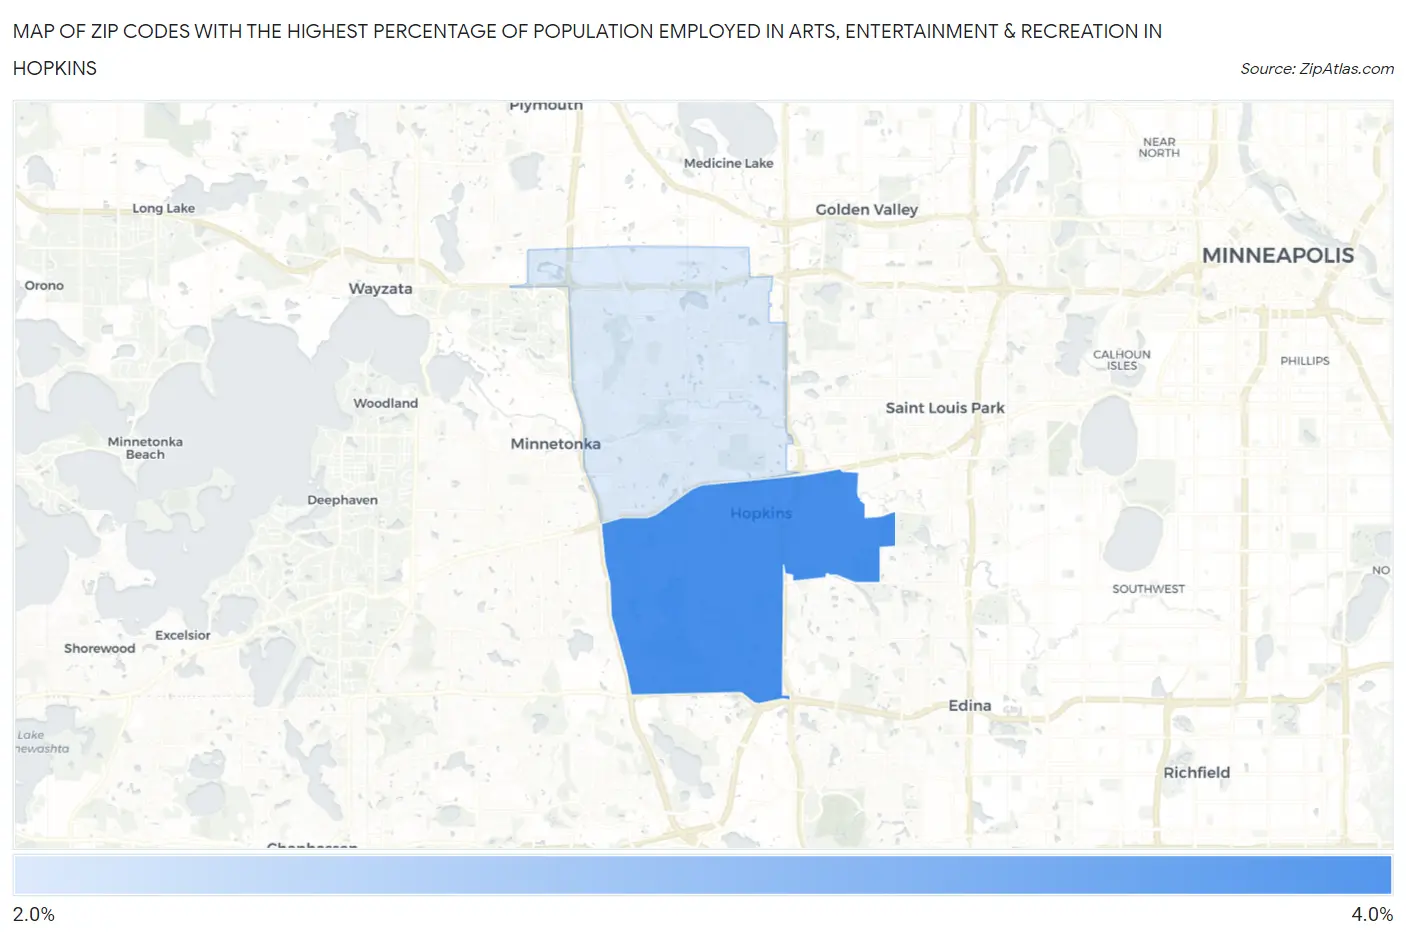
Map of Zip Codes with the Highest Percentage of Population Employed in Arts, Entertainment & Recreation in Hopkins
0.0%
4.0%
Zip Codes with the Highest Percentage of Population Employed in Arts, Entertainment & Recreation in Hopkins, MN
| Zip Code | % Employed | vs State | vs National | |
| 1. | 55343 | 3.9% | 1.9%(+1.94)#77 | 2.1%(+1.77)#3,545 |
| 2. | 55305 | 2.7% | 1.9%(+0.757)#176 | 2.1%(+0.589)#6,479 |
1
Common Questions
What are the Top Zip Codes with the Highest Percentage of Population Employed in Arts, Entertainment & Recreation in Hopkins, MN?
Top Zip Codes with the Highest Percentage of Population Employed in Arts, Entertainment & Recreation in Hopkins, MN are:
What zip code has the Highest Percentage of Population Employed in Arts, Entertainment & Recreation in Hopkins, MN?
55343 has the Highest Percentage of Population Employed in Arts, Entertainment & Recreation in Hopkins, MN with 3.9%.
What is the Percentage of Population Employed in Arts, Entertainment & Recreation in Hopkins, MN?
Percentage of Population Employed in Arts, Entertainment & Recreation in Hopkins is 2.7%.
What is the Percentage of Population Employed in Arts, Entertainment & Recreation in Minnesota?
Percentage of Population Employed in Arts, Entertainment & Recreation in Minnesota is 1.9%.
What is the Percentage of Population Employed in Arts, Entertainment & Recreation in the United States?
Percentage of Population Employed in Arts, Entertainment & Recreation in the United States is 2.1%.