Zip Codes with the Highest Percentage of Self-Employed / Incorporated in Burnsville, MN
RELATED REPORTS & OPTIONS
Self-Employed / Incorporated
Burnsville
Compare Zip Codes
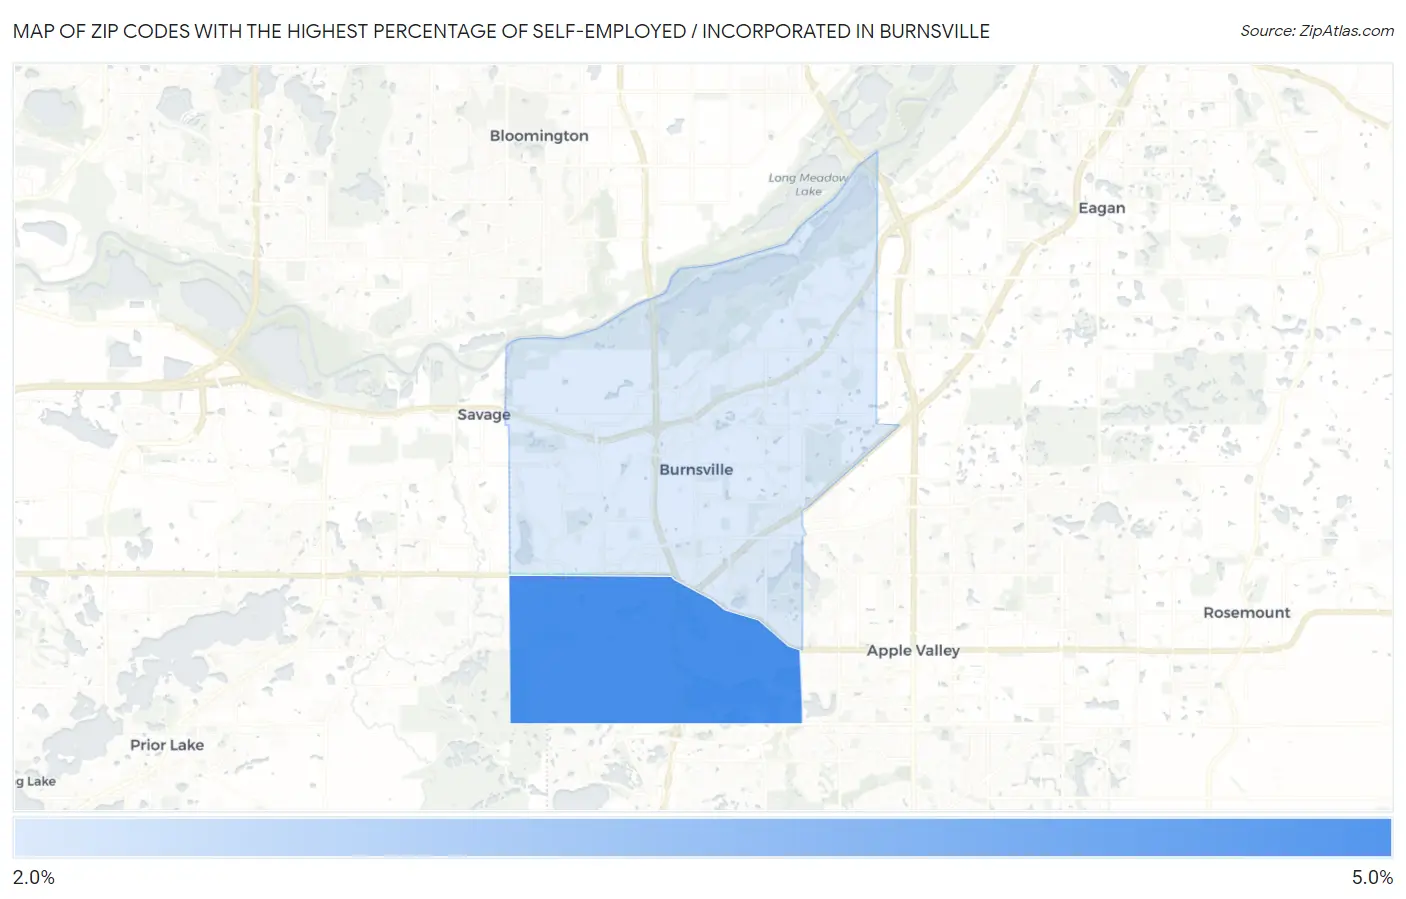
Map of Zip Codes with the Highest Percentage of Self-Employed / Incorporated in Burnsville
2.6%
4.5%
Zip Codes with the Highest Percentage of Self-Employed / Incorporated in Burnsville, MN
| Zip Code | % Self-Employed / Incorporated | vs State | vs National | |
| 1. | 55306 | 4.5% | 3.9%(+0.604)#349 | 3.8%(+0.708)#10,006 |
| 2. | 55337 | 2.6% | 3.9%(-1.34)#670 | 3.8%(-1.23)#18,500 |
1
Common Questions
What are the Top Zip Codes with the Highest Percentage of Self-Employed / Incorporated in Burnsville, MN?
Top Zip Codes with the Highest Percentage of Self-Employed / Incorporated in Burnsville, MN are:
What zip code has the Highest Percentage of Self-Employed / Incorporated in Burnsville, MN?
55306 has the Highest Percentage of Self-Employed / Incorporated in Burnsville, MN with 4.5%.
What is the Percentage of Self-Employed / Incorporated in Burnsville, MN?
Percentage of Self-Employed / Incorporated in Burnsville is 3.1%.
What is the Percentage of Self-Employed / Incorporated in Minnesota?
Percentage of Self-Employed / Incorporated in Minnesota is 3.9%.
What is the Percentage of Self-Employed / Incorporated in the United States?
Percentage of Self-Employed / Incorporated in the United States is 3.8%.