Zip Codes with the Highest Percentage of Population Employed in Sales & Related in Michigan
RELATED REPORTS & OPTIONS
Sales & Related
Michigan
Compare Zip Codes
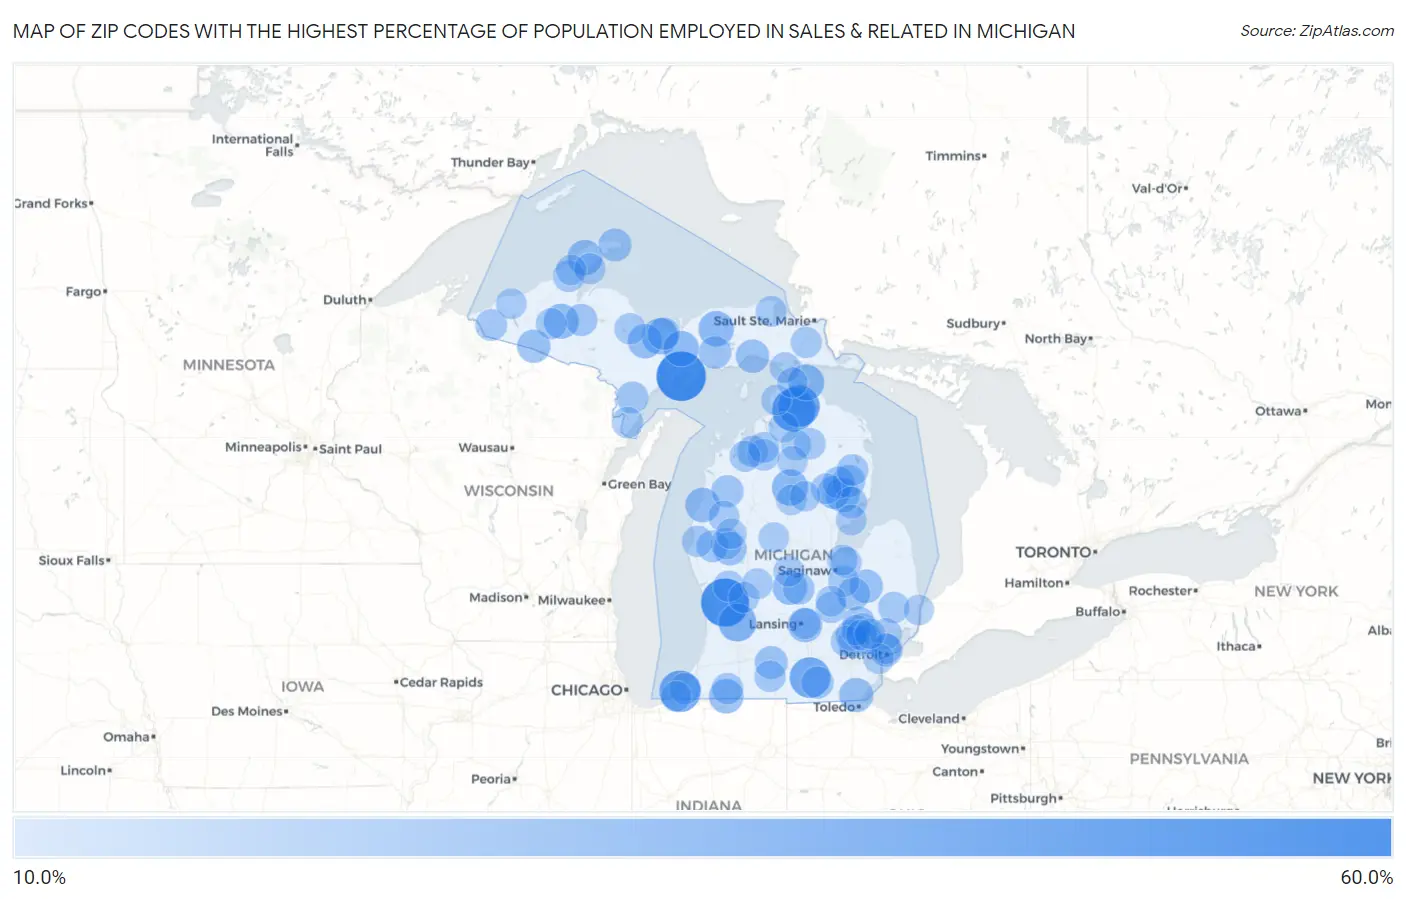
Map of Zip Codes with the Highest Percentage of Population Employed in Sales & Related in Michigan
10.0%
60.0%
Zip Codes with the Highest Percentage of Population Employed in Sales & Related in Michigan
| Zip Code | % Employed | vs State | vs National | |
| 1. | 49864 | 53.3% | 9.1%(+44.2)#1 | 9.6%(+43.7)#85 |
| 2. | 49430 | 50.0% | 9.1%(+40.9)#2 | 9.6%(+40.4)#114 |
| 3. | 49717 | 40.0% | 9.1%(+30.9)#3 | 9.6%(+30.4)#202 |
| 4. | 49791 | 36.8% | 9.1%(+27.7)#4 | 9.6%(+27.2)#242 |
| 5. | 49116 | 35.9% | 9.1%(+26.8)#5 | 9.6%(+26.3)#256 |
| 6. | 49282 | 34.4% | 9.1%(+25.2)#6 | 9.6%(+24.8)#285 |
| 7. | 49335 | 28.6% | 9.1%(+19.4)#7 | 9.6%(+19.0)#454 |
| 8. | 49826 | 25.0% | 9.1%(+15.9)#8 | 9.6%(+15.4)#631 |
| 9. | 48627 | 25.0% | 9.1%(+15.9)#9 | 9.6%(+15.4)#636 |
| 10. | 49775 | 25.0% | 9.1%(+15.9)#10 | 9.6%(+15.4)#645 |
| 11. | 49883 | 23.7% | 9.1%(+14.5)#11 | 9.6%(+14.1)#742 |
| 12. | 49895 | 23.5% | 9.1%(+14.4)#12 | 9.6%(+14.0)#753 |
| 13. | 49917 | 23.1% | 9.1%(+13.9)#13 | 9.6%(+13.5)#788 |
| 14. | 49961 | 22.7% | 9.1%(+13.6)#14 | 9.6%(+13.1)#828 |
| 15. | 49626 | 21.8% | 9.1%(+12.7)#15 | 9.6%(+12.2)#915 |
| 16. | 48856 | 21.6% | 9.1%(+12.5)#16 | 9.6%(+12.0)#944 |
| 17. | 49130 | 21.5% | 9.1%(+12.4)#17 | 9.6%(+11.9)#955 |
| 18. | 48824 | 21.5% | 9.1%(+12.4)#18 | 9.6%(+11.9)#956 |
| 19. | 49833 | 21.3% | 9.1%(+12.1)#19 | 9.6%(+11.7)#985 |
| 20. | 48739 | 20.9% | 9.1%(+11.8)#20 | 9.6%(+11.3)#1,026 |
| 21. | 48177 | 20.9% | 9.1%(+11.7)#21 | 9.6%(+11.3)#1,029 |
| 22. | 49762 | 19.5% | 9.1%(+10.4)#22 | 9.6%(+9.95)#1,226 |
| 23. | 48464 | 19.5% | 9.1%(+10.4)#23 | 9.6%(+9.92)#1,231 |
| 24. | 49969 | 19.2% | 9.1%(+10.1)#24 | 9.6%(+9.65)#1,289 |
| 25. | 49312 | 19.2% | 9.1%(+10.1)#25 | 9.6%(+9.64)#1,293 |
| 26. | 49918 | 18.5% | 9.1%(+9.38)#26 | 9.6%(+8.92)#1,434 |
| 27. | 48211 | 18.5% | 9.1%(+9.32)#27 | 9.6%(+8.86)#1,450 |
| 28. | 49033 | 18.3% | 9.1%(+9.19)#28 | 9.6%(+8.73)#1,480 |
| 29. | 48635 | 18.3% | 9.1%(+9.17)#29 | 9.6%(+8.72)#1,483 |
| 30. | 48737 | 17.9% | 9.1%(+8.78)#30 | 9.6%(+8.32)#1,589 |
| 31. | 48437 | 17.7% | 9.1%(+8.59)#31 | 9.6%(+8.14)#1,634 |
| 32. | 49840 | 17.5% | 9.1%(+8.35)#32 | 9.6%(+7.89)#1,694 |
| 33. | 49253 | 17.1% | 9.1%(+7.99)#33 | 9.6%(+7.53)#1,798 |
| 34. | 49825 | 17.1% | 9.1%(+7.96)#34 | 9.6%(+7.50)#1,808 |
| 35. | 48350 | 17.0% | 9.1%(+7.90)#35 | 9.6%(+7.44)#1,826 |
| 36. | 49625 | 16.7% | 9.1%(+7.57)#36 | 9.6%(+7.11)#1,922 |
| 37. | 49919 | 16.7% | 9.1%(+7.53)#37 | 9.6%(+7.07)#1,956 |
| 38. | 49812 | 16.4% | 9.1%(+7.29)#38 | 9.6%(+6.83)#2,045 |
| 39. | 48761 | 16.4% | 9.1%(+7.27)#39 | 9.6%(+6.81)#2,058 |
| 40. | 49459 | 15.9% | 9.1%(+6.74)#40 | 9.6%(+6.28)#2,288 |
| 41. | 48874 | 15.8% | 9.1%(+6.70)#41 | 9.6%(+6.25)#2,316 |
| 42. | 49959 | 15.8% | 9.1%(+6.69)#42 | 9.6%(+6.23)#2,325 |
| 43. | 48748 | 15.7% | 9.1%(+6.55)#43 | 9.6%(+6.09)#2,384 |
| 44. | 49963 | 15.5% | 9.1%(+6.41)#44 | 9.6%(+5.95)#2,446 |
| 45. | 48705 | 15.5% | 9.1%(+6.35)#45 | 9.6%(+5.89)#2,480 |
| 46. | 49125 | 15.4% | 9.1%(+6.22)#46 | 9.6%(+5.77)#2,546 |
| 47. | 49094 | 15.3% | 9.1%(+6.14)#47 | 9.6%(+5.68)#2,580 |
| 48. | 49309 | 15.1% | 9.1%(+5.94)#48 | 9.6%(+5.48)#2,686 |
| 49. | 49061 | 15.1% | 9.1%(+5.93)#49 | 9.6%(+5.47)#2,699 |
| 50. | 49893 | 15.0% | 9.1%(+5.85)#50 | 9.6%(+5.40)#2,734 |
| 51. | 48002 | 14.9% | 9.1%(+5.79)#51 | 9.6%(+5.33)#2,787 |
| 52. | 49449 | 14.9% | 9.1%(+5.74)#52 | 9.6%(+5.29)#2,812 |
| 53. | 49612 | 14.9% | 9.1%(+5.74)#53 | 9.6%(+5.28)#2,817 |
| 54. | 48476 | 14.9% | 9.1%(+5.73)#54 | 9.6%(+5.27)#2,819 |
| 55. | 49318 | 14.8% | 9.1%(+5.71)#55 | 9.6%(+5.25)#2,838 |
| 56. | 48386 | 14.8% | 9.1%(+5.66)#56 | 9.6%(+5.20)#2,870 |
| 57. | 49871 | 14.8% | 9.1%(+5.63)#57 | 9.6%(+5.17)#2,890 |
| 58. | 49751 | 14.7% | 9.1%(+5.59)#58 | 9.6%(+5.14)#2,913 |
| 59. | 48165 | 14.7% | 9.1%(+5.59)#59 | 9.6%(+5.13)#2,917 |
| 60. | 49629 | 14.7% | 9.1%(+5.54)#60 | 9.6%(+5.08)#2,960 |
| 61. | 48380 | 14.7% | 9.1%(+5.53)#61 | 9.6%(+5.08)#2,963 |
| 62. | 48415 | 14.6% | 9.1%(+5.46)#62 | 9.6%(+5.00)#3,022 |
| 63. | 49615 | 14.5% | 9.1%(+5.40)#63 | 9.6%(+4.95)#3,056 |
| 64. | 48314 | 14.5% | 9.1%(+5.36)#64 | 9.6%(+4.90)#3,088 |
| 65. | 49788 | 14.4% | 9.1%(+5.29)#65 | 9.6%(+4.84)#3,133 |
| 66. | 49644 | 14.4% | 9.1%(+5.23)#66 | 9.6%(+4.78)#3,188 |
| 67. | 49686 | 14.3% | 9.1%(+5.20)#67 | 9.6%(+4.74)#3,209 |
| 68. | 48116 | 14.3% | 9.1%(+5.17)#68 | 9.6%(+4.71)#3,227 |
| 69. | 49768 | 14.3% | 9.1%(+5.15)#69 | 9.6%(+4.69)#3,255 |
| 70. | 49967 | 14.3% | 9.1%(+5.15)#70 | 9.6%(+4.69)#3,257 |
| 71. | 49945 | 14.2% | 9.1%(+5.05)#71 | 9.6%(+4.59)#3,330 |
| 72. | 48825 | 14.2% | 9.1%(+5.04)#72 | 9.6%(+4.58)#3,336 |
| 73. | 48322 | 14.1% | 9.1%(+4.95)#73 | 9.6%(+4.49)#3,399 |
| 74. | 48747 | 14.1% | 9.1%(+4.92)#74 | 9.6%(+4.47)#3,432 |
| 75. | 48817 | 14.1% | 9.1%(+4.92)#75 | 9.6%(+4.46)#3,434 |
| 76. | 48703 | 14.0% | 9.1%(+4.87)#76 | 9.6%(+4.41)#3,474 |
| 77. | 48708 | 13.9% | 9.1%(+4.80)#77 | 9.6%(+4.35)#3,528 |
| 78. | 49306 | 13.9% | 9.1%(+4.79)#78 | 9.6%(+4.33)#3,539 |
| 79. | 48654 | 13.9% | 9.1%(+4.77)#79 | 9.6%(+4.31)#3,552 |
| 80. | 48832 | 13.8% | 9.1%(+4.63)#80 | 9.6%(+4.17)#3,679 |
| 81. | 49971 | 13.6% | 9.1%(+4.42)#81 | 9.6%(+3.96)#3,883 |
| 82. | 49781 | 13.6% | 9.1%(+4.42)#82 | 9.6%(+3.96)#3,892 |
| 83. | 49735 | 13.5% | 9.1%(+4.40)#83 | 9.6%(+3.95)#3,905 |
| 84. | 49931 | 13.5% | 9.1%(+4.33)#84 | 9.6%(+3.87)#3,974 |
| 85. | 49326 | 13.4% | 9.1%(+4.31)#85 | 9.6%(+3.85)#3,995 |
| 86. | 49642 | 13.4% | 9.1%(+4.29)#86 | 9.6%(+3.84)#4,009 |
| 87. | 49117 | 13.4% | 9.1%(+4.26)#87 | 9.6%(+3.81)#4,035 |
| 88. | 48629 | 13.4% | 9.1%(+4.25)#88 | 9.6%(+3.79)#4,047 |
| 89. | 48212 | 13.4% | 9.1%(+4.24)#89 | 9.6%(+3.78)#4,056 |
| 90. | 48356 | 13.4% | 9.1%(+4.22)#90 | 9.6%(+3.76)#4,098 |
| 91. | 48382 | 13.3% | 9.1%(+4.20)#91 | 9.6%(+3.75)#4,110 |
| 92. | 48122 | 13.3% | 9.1%(+4.19)#92 | 9.6%(+3.73)#4,140 |
| 93. | 48320 | 13.3% | 9.1%(+4.18)#93 | 9.6%(+3.72)#4,154 |
| 94. | 48040 | 13.3% | 9.1%(+4.16)#94 | 9.6%(+3.71)#4,165 |
| 95. | 49713 | 13.2% | 9.1%(+4.04)#95 | 9.6%(+3.59)#4,299 |
| 96. | 49740 | 13.2% | 9.1%(+4.04)#96 | 9.6%(+3.58)#4,306 |
| 97. | 49733 | 13.1% | 9.1%(+3.99)#97 | 9.6%(+3.53)#4,352 |
| 98. | 48656 | 13.1% | 9.1%(+3.98)#98 | 9.6%(+3.52)#4,360 |
| 99. | 48632 | 13.1% | 9.1%(+3.95)#99 | 9.6%(+3.50)#4,396 |
| 100. | 49701 | 13.0% | 9.1%(+3.87)#100 | 9.6%(+3.42)#4,469 |
Common Questions
What are the Top 10 Zip Codes with the Highest Percentage of Population Employed in Sales & Related in Michigan?
Top 10 Zip Codes with the Highest Percentage of Population Employed in Sales & Related in Michigan are:
What zip code has the Highest Percentage of Population Employed in Sales & Related in Michigan?
49864 has the Highest Percentage of Population Employed in Sales & Related in Michigan with 53.3%.
What is the Percentage of Population Employed in Sales & Related in the State of Michigan?
Percentage of Population Employed in Sales & Related in Michigan is 9.1%.
What is the Percentage of Population Employed in Sales & Related in the United States?
Percentage of Population Employed in Sales & Related in the United States is 9.6%.