Zip Codes with the Highest Percentage of Population Employed in Transportation & Warehousing in Michigan
RELATED REPORTS & OPTIONS
Transportation & Warehousing
Michigan
Compare Zip Codes
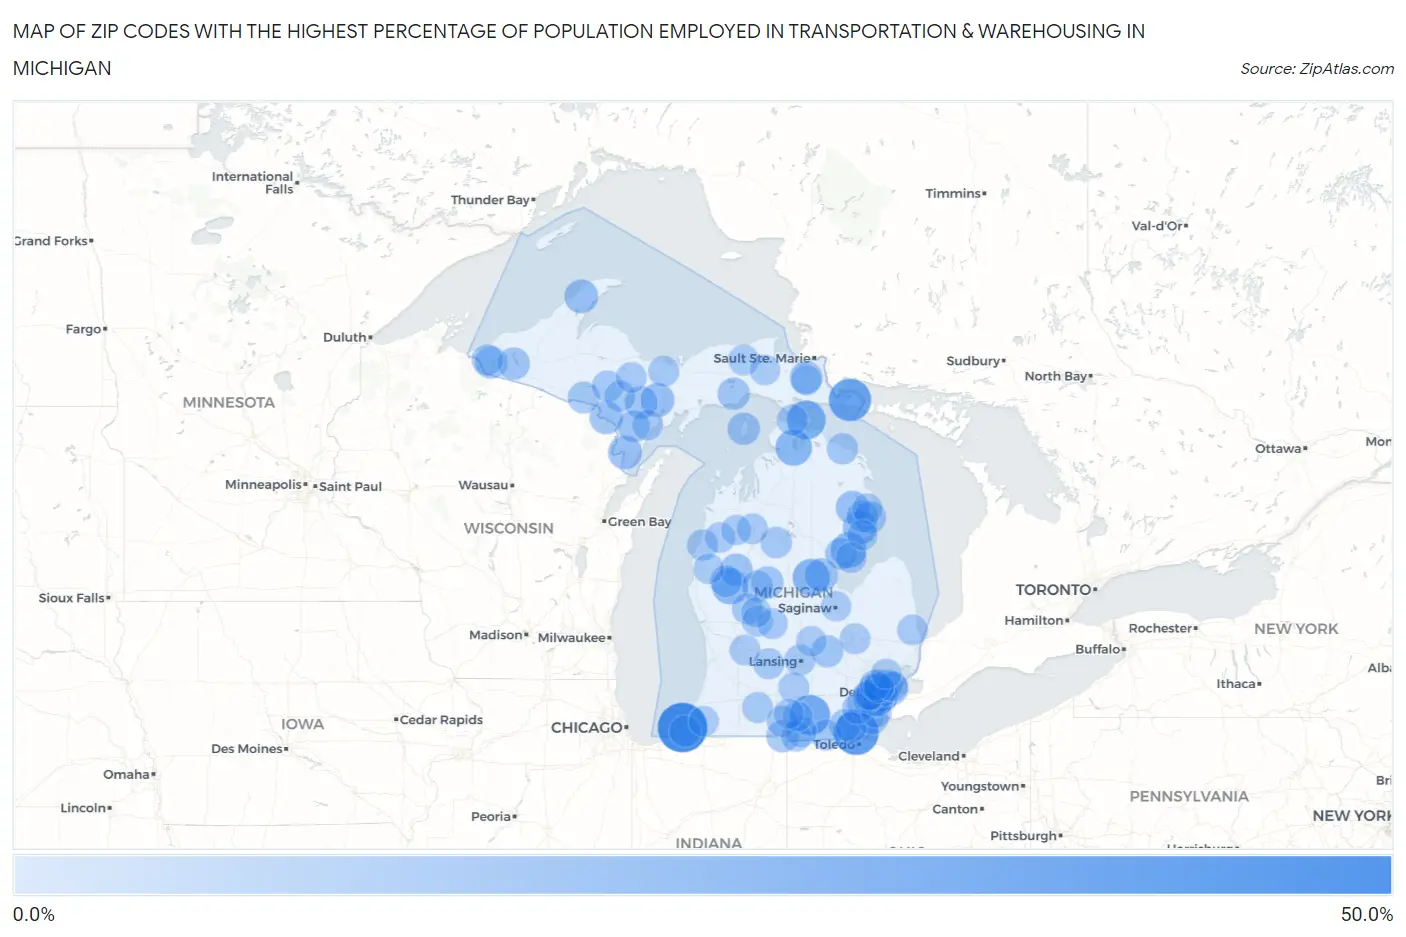
Map of Zip Codes with the Highest Percentage of Population Employed in Transportation & Warehousing in Michigan
0.0%
50.0%
Zip Codes with the Highest Percentage of Population Employed in Transportation & Warehousing in Michigan
| Zip Code | % Employed | vs State | vs National | |
| 1. | 49115 | 48.1% | 3.9%(+44.2)#1 | 4.9%(+43.1)#86 |
| 2. | 48177 | 38.1% | 3.9%(+34.2)#2 | 4.9%(+33.2)#146 |
| 3. | 49726 | 32.7% | 3.9%(+28.8)#3 | 4.9%(+27.7)#192 |
| 4. | 49282 | 28.1% | 3.9%(+24.2)#4 | 4.9%(+23.2)#269 |
| 5. | 49775 | 25.0% | 3.9%(+21.1)#5 | 4.9%(+20.1)#335 |
| 6. | 48620 | 21.5% | 3.9%(+17.6)#6 | 4.9%(+16.6)#452 |
| 7. | 49717 | 20.0% | 3.9%(+16.1)#7 | 4.9%(+15.1)#543 |
| 8. | 49312 | 19.2% | 3.9%(+15.3)#8 | 4.9%(+14.3)#581 |
| 9. | 48765 | 18.8% | 3.9%(+14.9)#9 | 4.9%(+13.9)#613 |
| 10. | 48750 | 15.0% | 3.9%(+11.1)#10 | 4.9%(+10.0)#1,070 |
| 11. | 49872 | 14.5% | 3.9%(+10.6)#11 | 4.9%(+9.60)#1,155 |
| 12. | 49848 | 14.3% | 3.9%(+10.4)#12 | 4.9%(+9.34)#1,215 |
| 13. | 49942 | 14.3% | 3.9%(+10.4)#13 | 4.9%(+9.34)#1,218 |
| 14. | 49876 | 13.7% | 3.9%(+9.76)#14 | 4.9%(+8.72)#1,357 |
| 15. | 48652 | 13.6% | 3.9%(+9.65)#15 | 4.9%(+8.61)#1,379 |
| 16. | 48705 | 13.5% | 3.9%(+9.64)#16 | 4.9%(+8.60)#1,380 |
| 17. | 49818 | 12.5% | 3.9%(+8.55)#17 | 4.9%(+7.51)#1,698 |
| 18. | 49623 | 12.4% | 3.9%(+8.51)#18 | 4.9%(+7.47)#1,708 |
| 19. | 49752 | 12.2% | 3.9%(+8.25)#19 | 4.9%(+7.21)#1,799 |
| 20. | 49782 | 11.9% | 3.9%(+8.03)#20 | 4.9%(+6.99)#1,893 |
| 21. | 49886 | 11.6% | 3.9%(+7.66)#21 | 4.9%(+6.62)#2,044 |
| 22. | 49255 | 11.5% | 3.9%(+7.61)#22 | 4.9%(+6.57)#2,070 |
| 23. | 49959 | 11.5% | 3.9%(+7.60)#23 | 4.9%(+6.56)#2,072 |
| 24. | 49838 | 11.5% | 3.9%(+7.55)#24 | 4.9%(+6.51)#2,091 |
| 25. | 49305 | 11.5% | 3.9%(+7.55)#25 | 4.9%(+6.51)#2,092 |
| 26. | 49947 | 11.4% | 3.9%(+7.48)#26 | 4.9%(+6.45)#2,127 |
| 27. | 48738 | 11.3% | 3.9%(+7.36)#27 | 4.9%(+6.32)#2,202 |
| 28. | 48217 | 11.0% | 3.9%(+7.11)#28 | 4.9%(+6.07)#2,317 |
| 29. | 48414 | 10.9% | 3.9%(+6.96)#29 | 4.9%(+5.92)#2,380 |
| 30. | 48745 | 10.7% | 3.9%(+6.83)#30 | 4.9%(+5.79)#2,456 |
| 31. | 49902 | 10.6% | 3.9%(+6.73)#31 | 4.9%(+5.69)#2,508 |
| 32. | 49309 | 10.6% | 3.9%(+6.66)#32 | 4.9%(+5.63)#2,543 |
| 33. | 48215 | 10.4% | 3.9%(+6.54)#33 | 4.9%(+5.50)#2,615 |
| 34. | 48766 | 10.3% | 3.9%(+6.42)#34 | 4.9%(+5.38)#2,695 |
| 35. | 49238 | 10.3% | 3.9%(+6.36)#35 | 4.9%(+5.32)#2,725 |
| 36. | 48218 | 10.2% | 3.9%(+6.28)#36 | 4.9%(+5.24)#2,768 |
| 37. | 49128 | 10.2% | 3.9%(+6.26)#37 | 4.9%(+5.22)#2,781 |
| 38. | 48126 | 10.0% | 3.9%(+6.09)#38 | 4.9%(+5.05)#2,896 |
| 39. | 49342 | 9.7% | 3.9%(+5.74)#39 | 4.9%(+4.71)#3,115 |
| 40. | 49632 | 9.6% | 3.9%(+5.72)#40 | 4.9%(+4.68)#3,140 |
| 41. | 49779 | 9.4% | 3.9%(+5.50)#41 | 4.9%(+4.47)#3,307 |
| 42. | 49911 | 9.3% | 3.9%(+5.41)#42 | 4.9%(+4.37)#3,379 |
| 43. | 49289 | 9.3% | 3.9%(+5.35)#43 | 4.9%(+4.31)#3,436 |
| 44. | 48174 | 9.3% | 3.9%(+5.35)#44 | 4.9%(+4.31)#3,437 |
| 45. | 48166 | 9.2% | 3.9%(+5.29)#45 | 4.9%(+4.26)#3,485 |
| 46. | 49815 | 9.2% | 3.9%(+5.28)#46 | 4.9%(+4.24)#3,502 |
| 47. | 49266 | 9.2% | 3.9%(+5.27)#47 | 4.9%(+4.24)#3,505 |
| 48. | 49634 | 9.2% | 3.9%(+5.27)#48 | 4.9%(+4.23)#3,513 |
| 49. | 49831 | 9.0% | 3.9%(+5.11)#49 | 4.9%(+4.07)#3,683 |
| 50. | 49082 | 9.0% | 3.9%(+5.10)#50 | 4.9%(+4.06)#3,694 |
| 51. | 48180 | 9.0% | 3.9%(+5.09)#51 | 4.9%(+4.05)#3,709 |
| 52. | 49701 | 8.9% | 3.9%(+5.01)#52 | 4.9%(+3.98)#3,785 |
| 53. | 49329 | 8.8% | 3.9%(+4.89)#53 | 4.9%(+3.85)#3,931 |
| 54. | 48122 | 8.7% | 3.9%(+4.78)#54 | 4.9%(+3.74)#4,064 |
| 55. | 48228 | 8.6% | 3.9%(+4.72)#55 | 4.9%(+3.68)#4,115 |
| 56. | 49825 | 8.5% | 3.9%(+4.64)#56 | 4.9%(+3.60)#4,217 |
| 57. | 48915 | 8.5% | 3.9%(+4.62)#57 | 4.9%(+3.58)#4,246 |
| 58. | 49052 | 8.5% | 3.9%(+4.60)#58 | 4.9%(+3.56)#4,261 |
| 59. | 48111 | 8.5% | 3.9%(+4.55)#59 | 4.9%(+3.51)#4,322 |
| 60. | 48897 | 8.4% | 3.9%(+4.48)#60 | 4.9%(+3.44)#4,399 |
| 61. | 48509 | 8.3% | 3.9%(+4.41)#61 | 4.9%(+3.37)#4,502 |
| 62. | 49663 | 8.3% | 3.9%(+4.40)#62 | 4.9%(+3.36)#4,508 |
| 63. | 48703 | 8.2% | 3.9%(+4.33)#63 | 4.9%(+3.29)#4,592 |
| 64. | 49270 | 8.2% | 3.9%(+4.33)#64 | 4.9%(+3.29)#4,596 |
| 65. | 48191 | 8.2% | 3.9%(+4.32)#65 | 4.9%(+3.29)#4,600 |
| 66. | 48173 | 8.2% | 3.9%(+4.27)#66 | 4.9%(+3.23)#4,660 |
| 67. | 49326 | 8.1% | 3.9%(+4.24)#67 | 4.9%(+3.20)#4,708 |
| 68. | 48195 | 8.1% | 3.9%(+4.22)#68 | 4.9%(+3.19)#4,718 |
| 69. | 49512 | 8.1% | 3.9%(+4.21)#69 | 4.9%(+3.17)#4,731 |
| 70. | 49841 | 8.1% | 3.9%(+4.20)#70 | 4.9%(+3.16)#4,738 |
| 71. | 48235 | 8.0% | 3.9%(+4.14)#71 | 4.9%(+3.10)#4,833 |
| 72. | 49232 | 8.0% | 3.9%(+4.11)#72 | 4.9%(+3.07)#4,875 |
| 73. | 49284 | 8.0% | 3.9%(+4.09)#73 | 4.9%(+3.05)#4,906 |
| 74. | 49807 | 8.0% | 3.9%(+4.08)#74 | 4.9%(+3.04)#4,917 |
| 75. | 48032 | 8.0% | 3.9%(+4.05)#75 | 4.9%(+3.01)#4,955 |
| 76. | 48239 | 7.9% | 3.9%(+4.03)#76 | 4.9%(+3.00)#4,975 |
| 77. | 48210 | 7.9% | 3.9%(+4.03)#77 | 4.9%(+2.99)#4,983 |
| 78. | 48184 | 7.9% | 3.9%(+3.99)#78 | 4.9%(+2.95)#5,045 |
| 79. | 48141 | 7.8% | 3.9%(+3.93)#79 | 4.9%(+2.89)#5,138 |
| 80. | 49868 | 7.8% | 3.9%(+3.92)#80 | 4.9%(+2.88)#5,146 |
| 81. | 48884 | 7.8% | 3.9%(+3.90)#81 | 4.9%(+2.86)#5,171 |
| 82. | 48234 | 7.8% | 3.9%(+3.87)#82 | 4.9%(+2.83)#5,224 |
| 83. | 49788 | 7.7% | 3.9%(+3.81)#83 | 4.9%(+2.77)#5,294 |
| 84. | 48186 | 7.6% | 3.9%(+3.72)#84 | 4.9%(+2.69)#5,430 |
| 85. | 49619 | 7.6% | 3.9%(+3.72)#85 | 4.9%(+2.68)#5,440 |
| 86. | 48224 | 7.6% | 3.9%(+3.71)#86 | 4.9%(+2.67)#5,476 |
| 87. | 49405 | 7.6% | 3.9%(+3.69)#87 | 4.9%(+2.65)#5,500 |
| 88. | 48740 | 7.6% | 3.9%(+3.66)#88 | 4.9%(+2.62)#5,534 |
| 89. | 48219 | 7.6% | 3.9%(+3.65)#89 | 4.9%(+2.61)#5,559 |
| 90. | 48227 | 7.5% | 3.9%(+3.62)#90 | 4.9%(+2.59)#5,589 |
| 91. | 49748 | 7.5% | 3.9%(+3.59)#91 | 4.9%(+2.55)#5,645 |
| 92. | 48730 | 7.4% | 3.9%(+3.51)#92 | 4.9%(+2.47)#5,795 |
| 93. | 48866 | 7.4% | 3.9%(+3.49)#93 | 4.9%(+2.45)#5,826 |
| 94. | 48607 | 7.4% | 3.9%(+3.47)#94 | 4.9%(+2.43)#5,856 |
| 95. | 49102 | 7.3% | 3.9%(+3.39)#95 | 4.9%(+2.35)#6,006 |
| 96. | 49668 | 7.2% | 3.9%(+3.29)#96 | 4.9%(+2.25)#6,183 |
| 97. | 49250 | 7.2% | 3.9%(+3.28)#97 | 4.9%(+2.24)#6,200 |
| 98. | 48310 | 7.2% | 3.9%(+3.28)#98 | 4.9%(+2.24)#6,201 |
| 99. | 49252 | 7.2% | 3.9%(+3.25)#99 | 4.9%(+2.21)#6,247 |
| 100. | 49322 | 7.2% | 3.9%(+3.25)#100 | 4.9%(+2.21)#6,254 |
Common Questions
What are the Top 10 Zip Codes with the Highest Percentage of Population Employed in Transportation & Warehousing in Michigan?
Top 10 Zip Codes with the Highest Percentage of Population Employed in Transportation & Warehousing in Michigan are:
What zip code has the Highest Percentage of Population Employed in Transportation & Warehousing in Michigan?
49115 has the Highest Percentage of Population Employed in Transportation & Warehousing in Michigan with 48.1%.
What is the Percentage of Population Employed in Transportation & Warehousing in the State of Michigan?
Percentage of Population Employed in Transportation & Warehousing in Michigan is 3.9%.
What is the Percentage of Population Employed in Transportation & Warehousing in the United States?
Percentage of Population Employed in Transportation & Warehousing in the United States is 4.9%.