Zip Codes with the Highest Percentage of Population Employed in Agriculture, Fishing & Hunting in Ypsilanti, MI
RELATED REPORTS & OPTIONS
Agriculture, Fishing & Hunting
Ypsilanti
Compare Zip Codes
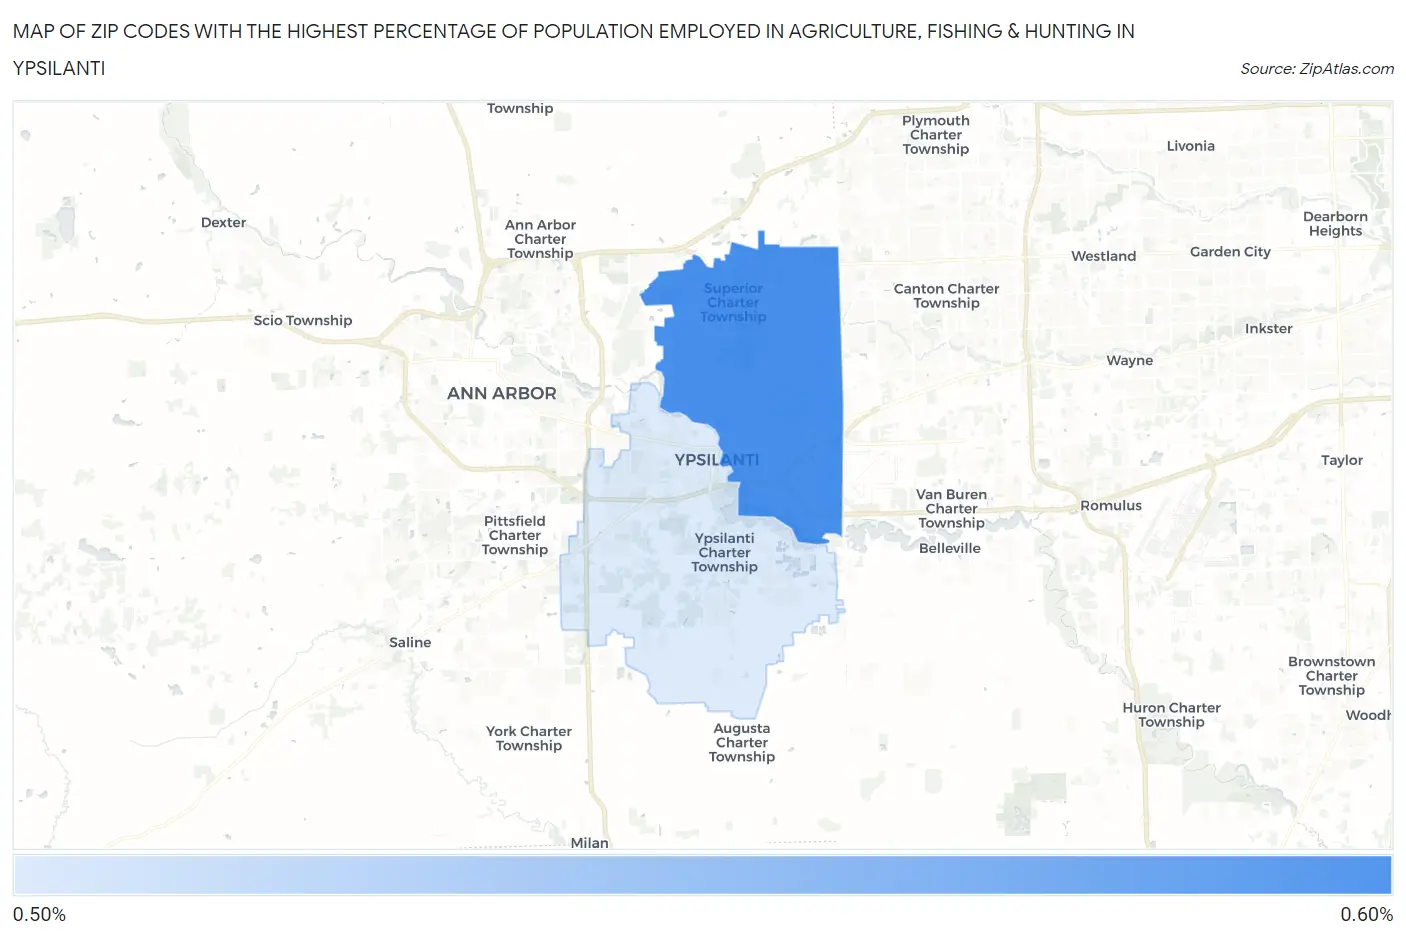
Map of Zip Codes with the Highest Percentage of Population Employed in Agriculture, Fishing & Hunting in Ypsilanti
0.0%
0.60%
Zip Codes with the Highest Percentage of Population Employed in Agriculture, Fishing & Hunting in Ypsilanti, MI
| Zip Code | % Employed | vs State | vs National | |
| 1. | 48198 | 0.60% | 0.98%(-0.387)#613 | 1.2%(-0.602)#18,508 |
| 2. | 48197 | 0.53% | 0.98%(-0.456)#631 | 1.2%(-0.672)#19,032 |
1
Common Questions
What are the Top Zip Codes with the Highest Percentage of Population Employed in Agriculture, Fishing & Hunting in Ypsilanti, MI?
Top Zip Codes with the Highest Percentage of Population Employed in Agriculture, Fishing & Hunting in Ypsilanti, MI are:
What zip code has the Highest Percentage of Population Employed in Agriculture, Fishing & Hunting in Ypsilanti, MI?
48198 has the Highest Percentage of Population Employed in Agriculture, Fishing & Hunting in Ypsilanti, MI with 0.60%.
What is the Percentage of Population Employed in Agriculture, Fishing & Hunting in Ypsilanti, MI?
Percentage of Population Employed in Agriculture, Fishing & Hunting in Ypsilanti is 0.40%.
What is the Percentage of Population Employed in Agriculture, Fishing & Hunting in Michigan?
Percentage of Population Employed in Agriculture, Fishing & Hunting in Michigan is 0.98%.
What is the Percentage of Population Employed in Agriculture, Fishing & Hunting in the United States?
Percentage of Population Employed in Agriculture, Fishing & Hunting in the United States is 1.2%.