Zip Codes with the Highest Percentage of Population Employed in Farming, Fishing & Forestry in White Lake, MI
RELATED REPORTS & OPTIONS
Select to Compare
Select to Compare
Compare Zip Codes
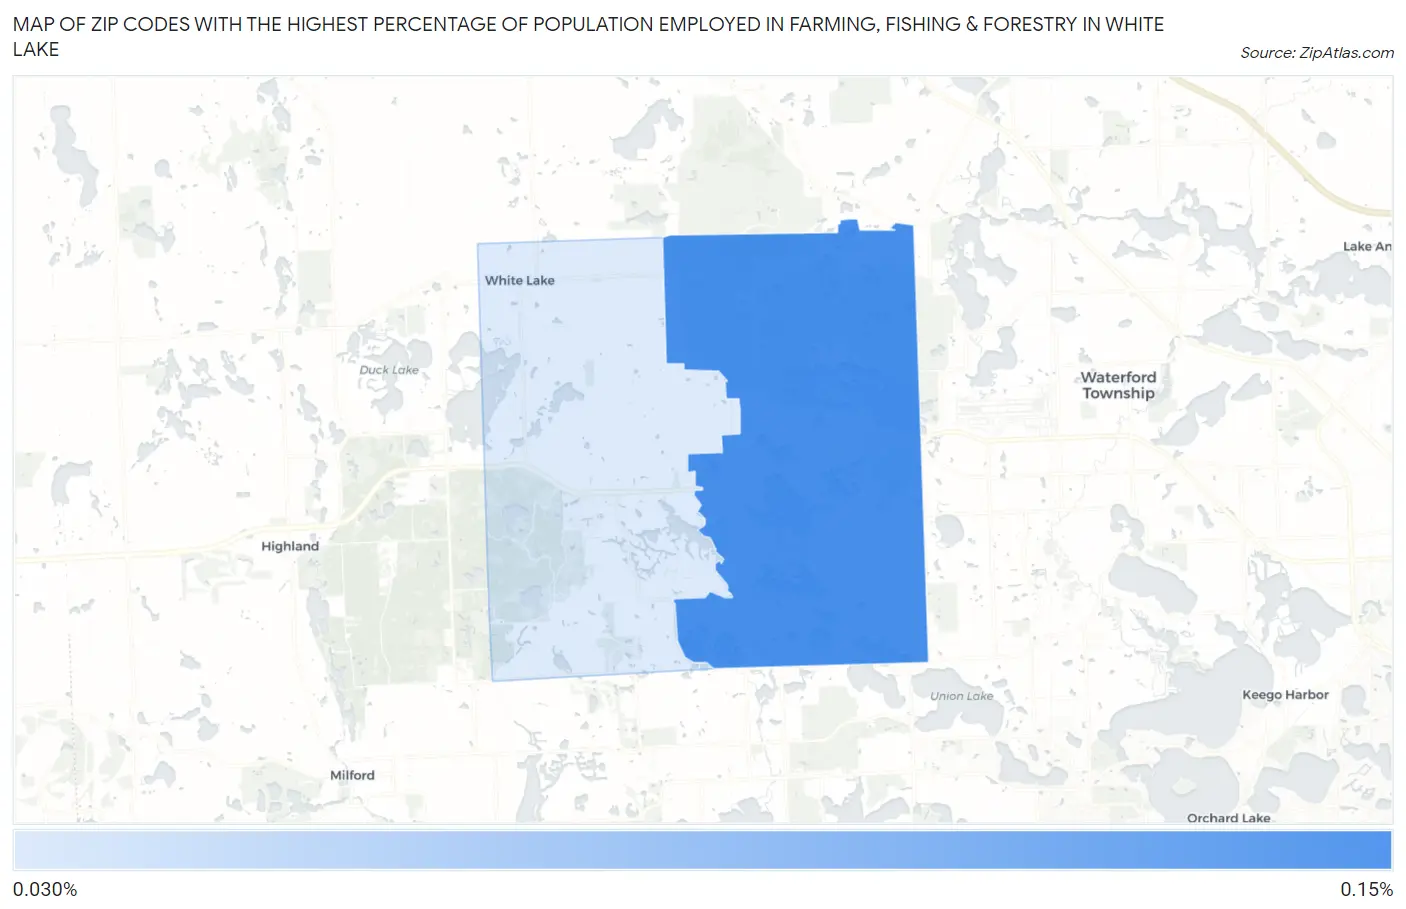
Map of Zip Codes with the Highest Percentage of Population Employed in Farming, Fishing & Forestry in White Lake
0.0%
0.10%
Zip Codes with the Highest Percentage of Population Employed in Farming, Fishing & Forestry in White Lake, MI
| Zip Code | % Employed | vs State | vs National | |
| 1. | 48386 | 0.091% | 0.47%(-0.376)#639 | 0.61%(-0.515)#17,914 |
1
Common Questions
What are the Top Zip Codes with the Highest Percentage of Population Employed in Farming, Fishing & Forestry in White Lake, MI?
Top Zip Codes with the Highest Percentage of Population Employed in Farming, Fishing & Forestry in White Lake, MI are:
What zip code has the Highest Percentage of Population Employed in Farming, Fishing & Forestry in White Lake, MI?
48386 has the Highest Percentage of Population Employed in Farming, Fishing & Forestry in White Lake, MI with 0.091%.
What is the Percentage of Population Employed in Farming, Fishing & Forestry in Michigan?
Percentage of Population Employed in Farming, Fishing & Forestry in Michigan is 0.47%.
What is the Percentage of Population Employed in Farming, Fishing & Forestry in the United States?
Percentage of Population Employed in Farming, Fishing & Forestry in the United States is 0.61%.