Zip Codes with the Highest Percentage of Population Employed in Arts, Entertainment & Recreation in Westland, MI
RELATED REPORTS & OPTIONS
Arts, Entertainment & Recreation
Westland
Compare Zip Codes
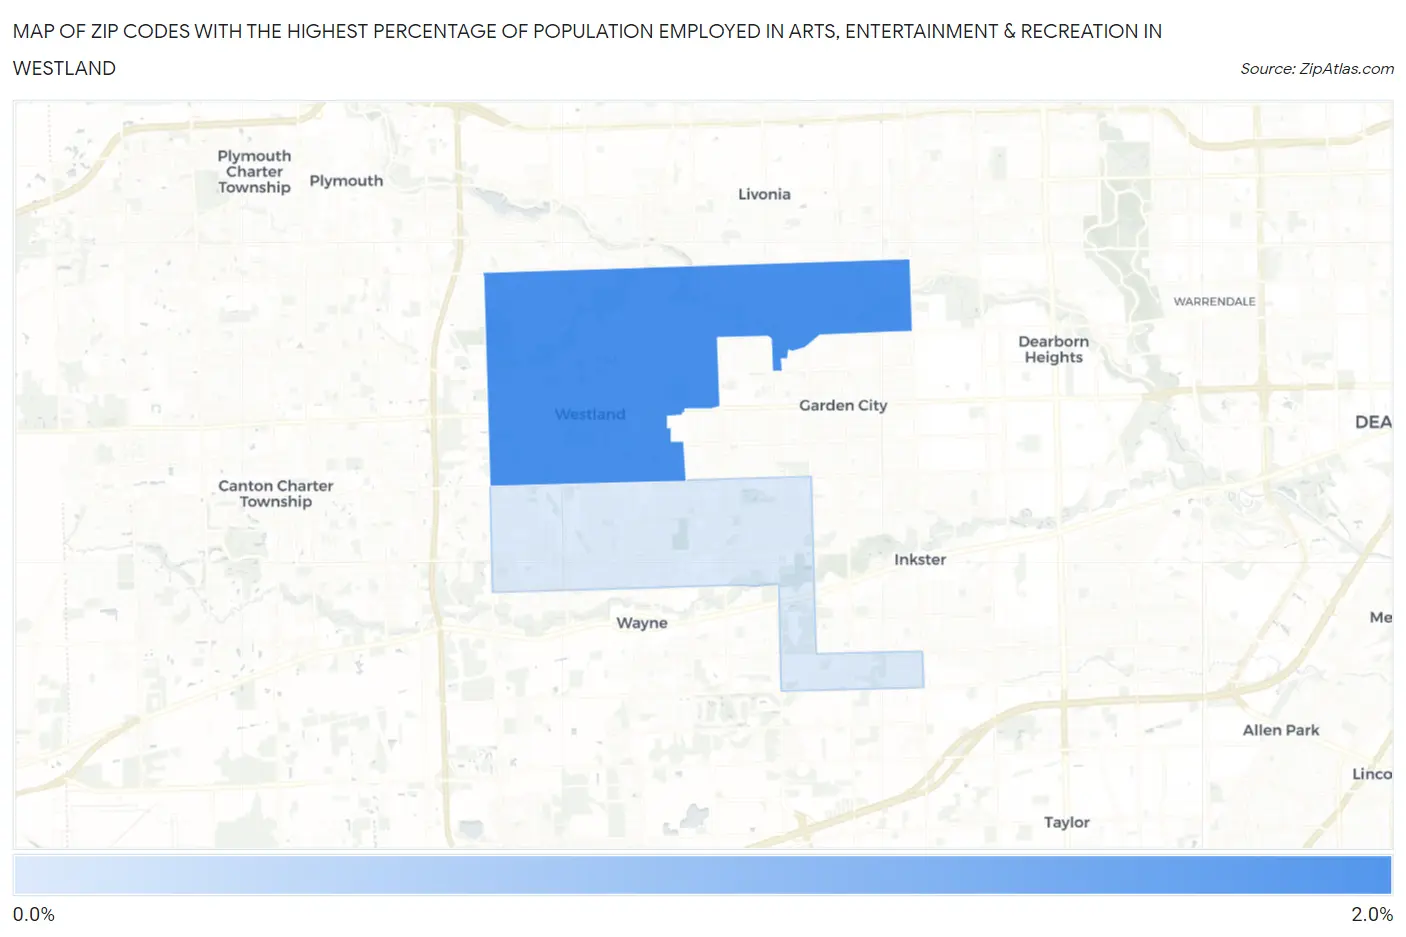
Map of Zip Codes with the Highest Percentage of Population Employed in Arts, Entertainment & Recreation in Westland
0.0%
2.0%
Zip Codes with the Highest Percentage of Population Employed in Arts, Entertainment & Recreation in Westland, MI
| Zip Code | % Employed | vs State | vs National | |
| 1. | 48185 | 1.6% | 1.8%(-0.236)#444 | 2.1%(-0.532)#12,858 |
| 2. | 48186 | 1.00% | 1.8%(-0.786)#606 | 2.1%(-1.08)#16,961 |
1
Common Questions
What are the Top Zip Codes with the Highest Percentage of Population Employed in Arts, Entertainment & Recreation in Westland, MI?
Top Zip Codes with the Highest Percentage of Population Employed in Arts, Entertainment & Recreation in Westland, MI are:
What zip code has the Highest Percentage of Population Employed in Arts, Entertainment & Recreation in Westland, MI?
48185 has the Highest Percentage of Population Employed in Arts, Entertainment & Recreation in Westland, MI with 1.6%.
What is the Percentage of Population Employed in Arts, Entertainment & Recreation in Westland, MI?
Percentage of Population Employed in Arts, Entertainment & Recreation in Westland is 1.3%.
What is the Percentage of Population Employed in Arts, Entertainment & Recreation in Michigan?
Percentage of Population Employed in Arts, Entertainment & Recreation in Michigan is 1.8%.
What is the Percentage of Population Employed in Arts, Entertainment & Recreation in the United States?
Percentage of Population Employed in Arts, Entertainment & Recreation in the United States is 2.1%.