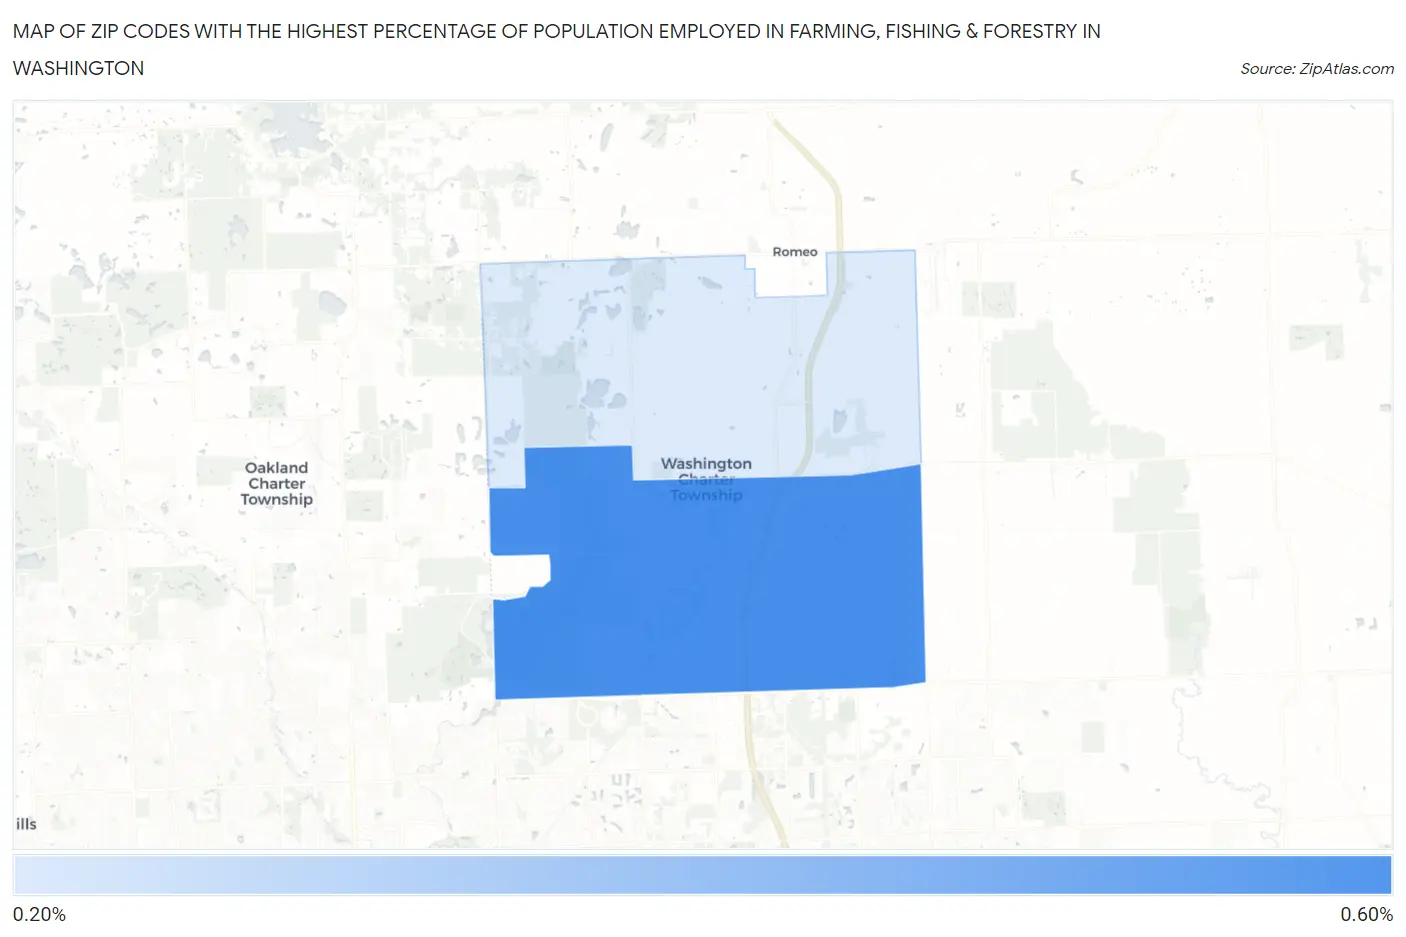
Zip Codes with the Highest Percentage of Population Employed in Farming, Fishing & Forestry in Washington, MI
RELATED REPORTS & OPTIONS
Farming, Fishing & Forestry
Washington
Compare Zip Codes
Map of Zip Codes with the Highest Percentage of Population Employed in Farming, Fishing & Forestry in Washington
0.0%
0.60%
Zip Codes with the Highest Percentage of Population Employed in Farming, Fishing & Forestry in Washington, MI
| Zip Code | % Employed | vs State | vs National | |
| 1. | 48094 | 0.57% | 0.47%(+0.105)#398 | 0.61%(-0.034)#12,284 |
| 2. | 48095 | 0.21% | 0.47%(-0.258)#561 | 0.61%(-0.397)#16,015 |
1
Common Questions
What are the Top Zip Codes with the Highest Percentage of Population Employed in Farming, Fishing & Forestry in Washington, MI?
Top Zip Codes with the Highest Percentage of Population Employed in Farming, Fishing & Forestry in Washington, MI are:
What zip code has the Highest Percentage of Population Employed in Farming, Fishing & Forestry in Washington, MI?
48094 has the Highest Percentage of Population Employed in Farming, Fishing & Forestry in Washington, MI with 0.57%.
What is the Percentage of Population Employed in Farming, Fishing & Forestry in Michigan?
Percentage of Population Employed in Farming, Fishing & Forestry in Michigan is 0.47%.
What is the Percentage of Population Employed in Farming, Fishing & Forestry in the United States?
Percentage of Population Employed in Farming, Fishing & Forestry in the United States is 0.61%.