Zip Codes with the Highest Percentage of Population Employed in Transportation & Warehousing in Utica, MI
RELATED REPORTS & OPTIONS
Transportation & Warehousing
Utica
Compare Zip Codes
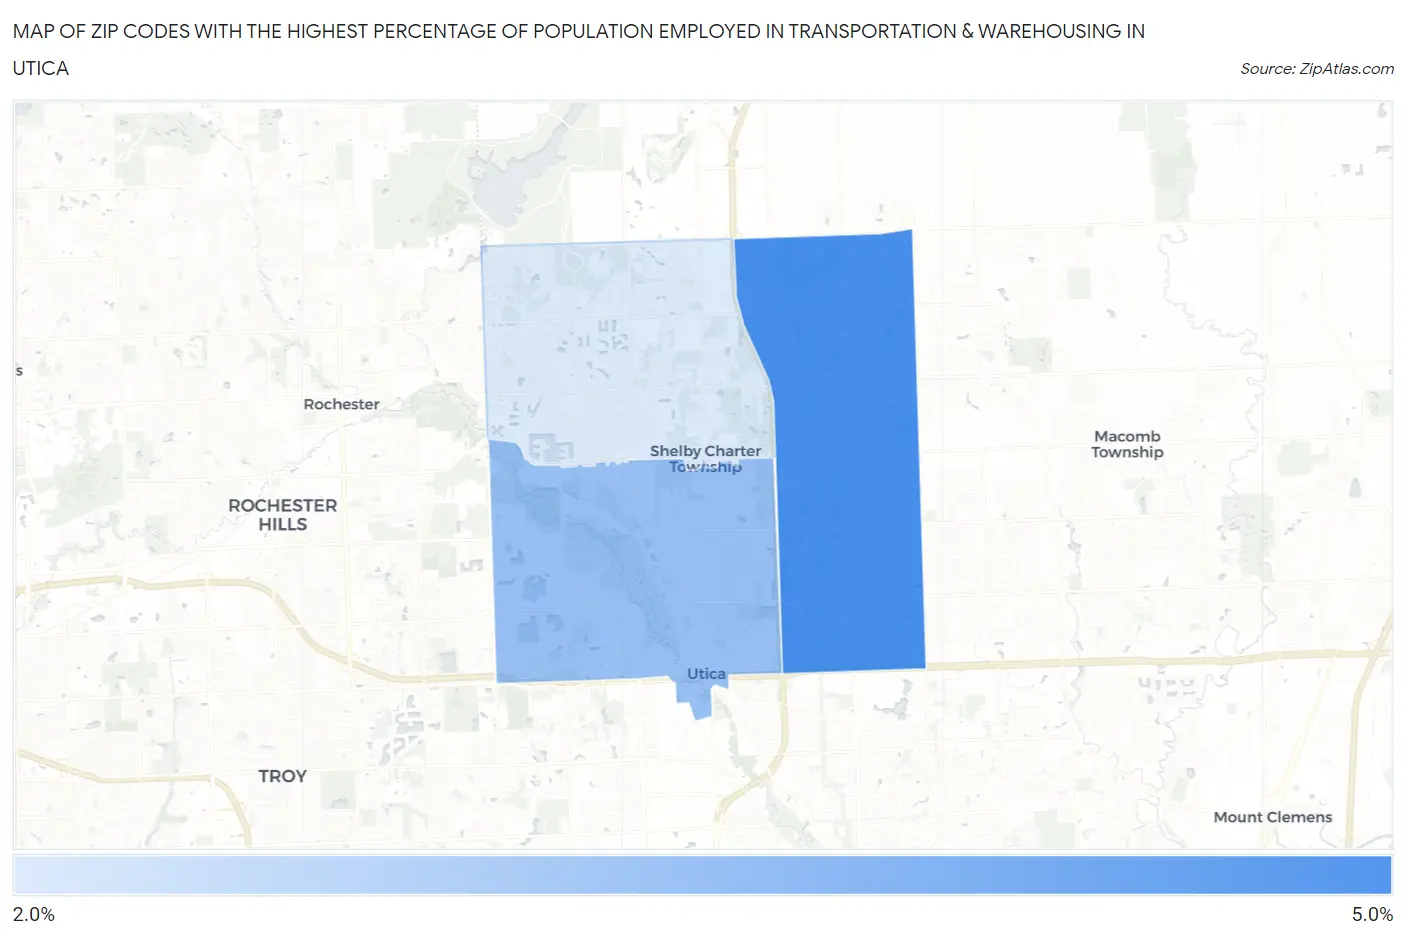
Map of Zip Codes with the Highest Percentage of Population Employed in Transportation & Warehousing in Utica
0.0%
5.0%
Zip Codes with the Highest Percentage of Population Employed in Transportation & Warehousing in Utica, MI
| Zip Code | % Employed | vs State | vs National | |
| 1. | 48315 | 4.3% | 3.9%(+0.426)#345 | 4.9%(-0.613)#14,462 |
| 2. | 48317 | 3.4% | 3.9%(-0.504)#505 | 4.9%(-1.54)#18,474 |
| 3. | 48316 | 2.6% | 3.9%(-1.30)#664 | 4.9%(-2.34)#21,938 |
1
Common Questions
What are the Top Zip Codes with the Highest Percentage of Population Employed in Transportation & Warehousing in Utica, MI?
Top Zip Codes with the Highest Percentage of Population Employed in Transportation & Warehousing in Utica, MI are:
What zip code has the Highest Percentage of Population Employed in Transportation & Warehousing in Utica, MI?
48315 has the Highest Percentage of Population Employed in Transportation & Warehousing in Utica, MI with 4.3%.
What is the Percentage of Population Employed in Transportation & Warehousing in Utica, MI?
Percentage of Population Employed in Transportation & Warehousing in Utica is 3.4%.
What is the Percentage of Population Employed in Transportation & Warehousing in Michigan?
Percentage of Population Employed in Transportation & Warehousing in Michigan is 3.9%.
What is the Percentage of Population Employed in Transportation & Warehousing in the United States?
Percentage of Population Employed in Transportation & Warehousing in the United States is 4.9%.