Zip Codes with the Highest Percentage of Population Employed in Agriculture, Fishing & Hunting in Traverse City, MI
RELATED REPORTS & OPTIONS
Agriculture, Fishing & Hunting
Traverse City
Compare Zip Codes
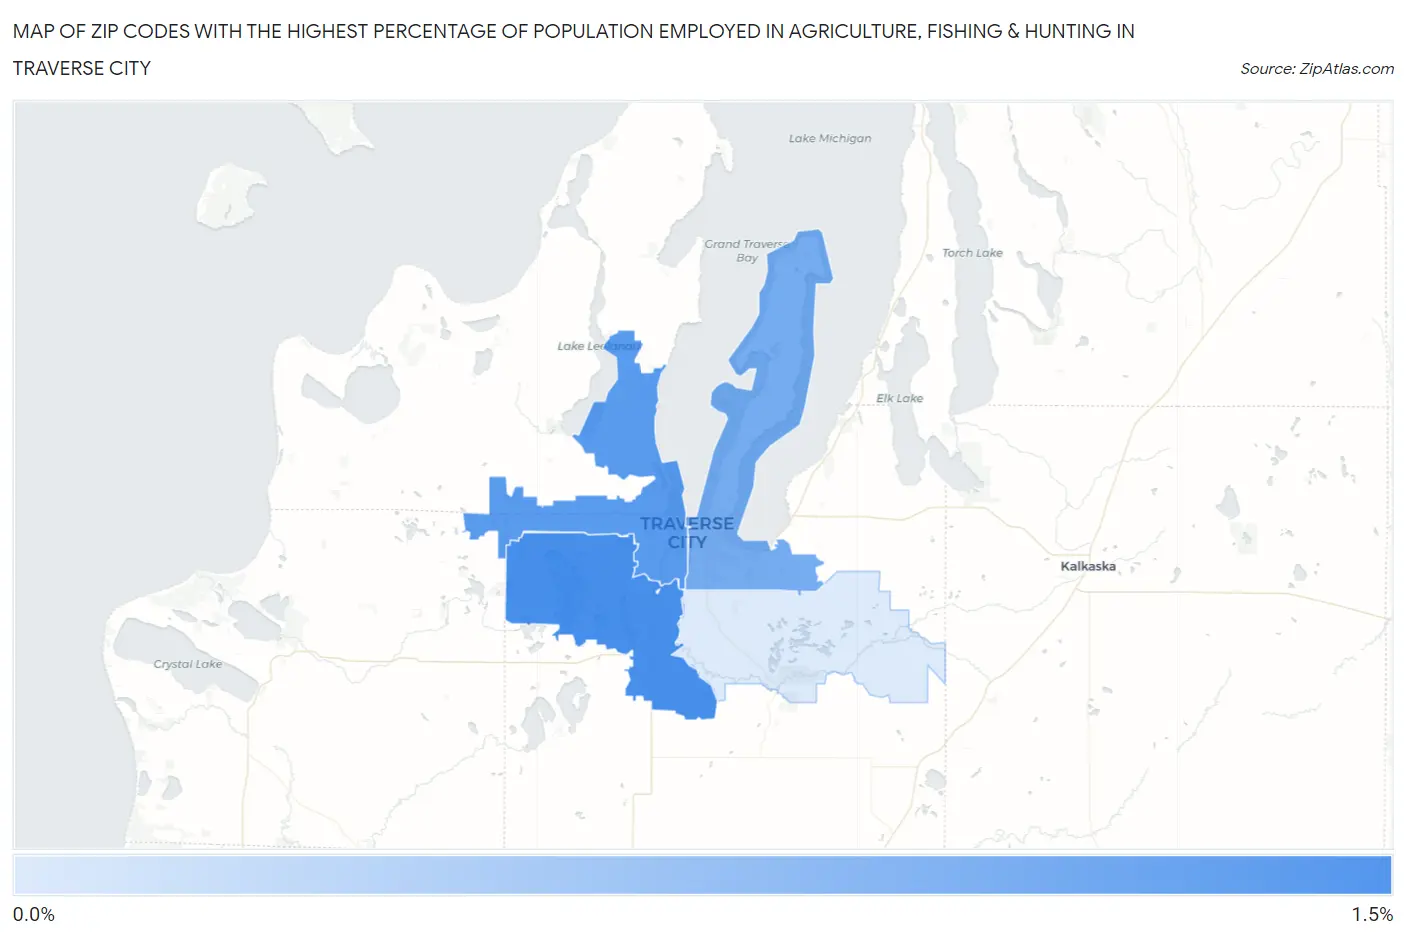
Map of Zip Codes with the Highest Percentage of Population Employed in Agriculture, Fishing & Hunting in Traverse City
0.0%
1.5%
Zip Codes with the Highest Percentage of Population Employed in Agriculture, Fishing & Hunting in Traverse City, MI
| Zip Code | % Employed | vs State | vs National | |
| 1. | 49685 | 1.3% | 0.98%(+0.321)#454 | 1.2%(+0.105)#15,009 |
| 2. | 49684 | 1.2% | 0.98%(+0.180)#481 | 1.2%(-0.036)#15,544 |
| 3. | 49686 | 0.91% | 0.98%(-0.070)#531 | 1.2%(-0.286)#16,638 |
| 4. | 49696 | 0.056% | 0.98%(-0.928)#811 | 1.2%(-1.14)#24,279 |
1
Common Questions
What are the Top 3 Zip Codes with the Highest Percentage of Population Employed in Agriculture, Fishing & Hunting in Traverse City, MI?
Top 3 Zip Codes with the Highest Percentage of Population Employed in Agriculture, Fishing & Hunting in Traverse City, MI are:
What zip code has the Highest Percentage of Population Employed in Agriculture, Fishing & Hunting in Traverse City, MI?
49685 has the Highest Percentage of Population Employed in Agriculture, Fishing & Hunting in Traverse City, MI with 1.3%.
What is the Percentage of Population Employed in Agriculture, Fishing & Hunting in Traverse City, MI?
Percentage of Population Employed in Agriculture, Fishing & Hunting in Traverse City is 0.42%.
What is the Percentage of Population Employed in Agriculture, Fishing & Hunting in Michigan?
Percentage of Population Employed in Agriculture, Fishing & Hunting in Michigan is 0.98%.
What is the Percentage of Population Employed in Agriculture, Fishing & Hunting in the United States?
Percentage of Population Employed in Agriculture, Fishing & Hunting in the United States is 1.2%.