Zip Codes with the Highest Percentage of Population Employed in Arts, Entertainment & Recreation in Sterling Heights, MI
RELATED REPORTS & OPTIONS
Arts, Entertainment & Recreation
Sterling Heights
Compare Zip Codes
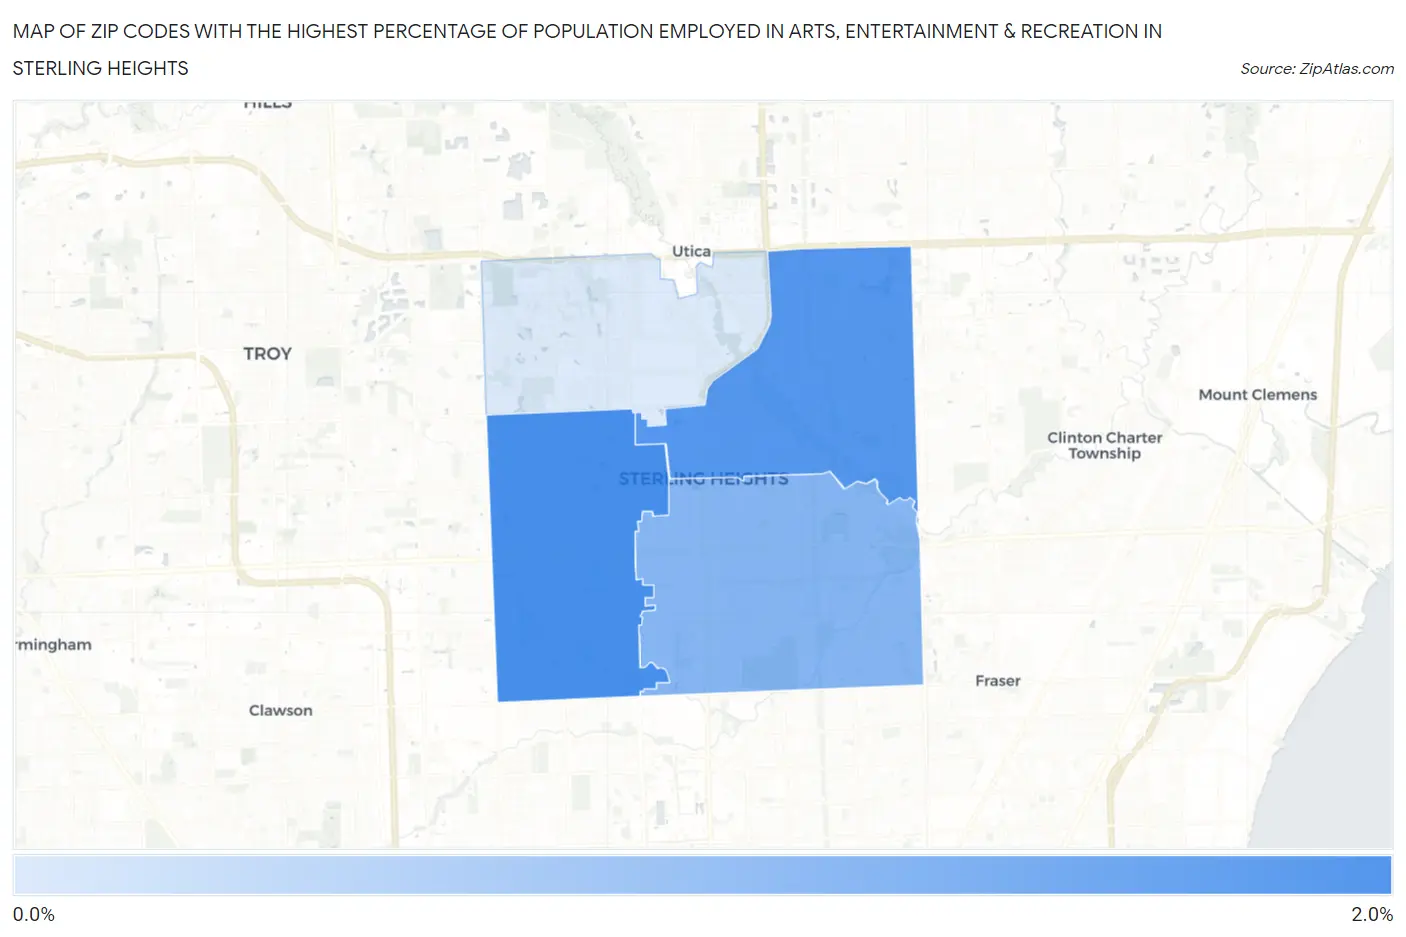
Map of Zip Codes with the Highest Percentage of Population Employed in Arts, Entertainment & Recreation in Sterling Heights
0.0%
2.0%
Zip Codes with the Highest Percentage of Population Employed in Arts, Entertainment & Recreation in Sterling Heights, MI
| Zip Code | % Employed | vs State | vs National | |
| 1. | 48310 | 1.8% | 1.8%(+0.054)#350 | 2.1%(-0.243)#10,758 |
| 2. | 48313 | 1.8% | 1.8%(-0.026)#375 | 2.1%(-0.322)#11,292 |
| 3. | 48312 | 1.5% | 1.8%(-0.302)#469 | 2.1%(-0.598)#13,337 |
| 4. | 48314 | 0.98% | 1.8%(-0.806)#610 | 2.1%(-1.10)#17,120 |
1
Common Questions
What are the Top 3 Zip Codes with the Highest Percentage of Population Employed in Arts, Entertainment & Recreation in Sterling Heights, MI?
Top 3 Zip Codes with the Highest Percentage of Population Employed in Arts, Entertainment & Recreation in Sterling Heights, MI are:
What zip code has the Highest Percentage of Population Employed in Arts, Entertainment & Recreation in Sterling Heights, MI?
48310 has the Highest Percentage of Population Employed in Arts, Entertainment & Recreation in Sterling Heights, MI with 1.8%.
What is the Percentage of Population Employed in Arts, Entertainment & Recreation in Sterling Heights, MI?
Percentage of Population Employed in Arts, Entertainment & Recreation in Sterling Heights is 1.6%.
What is the Percentage of Population Employed in Arts, Entertainment & Recreation in Michigan?
Percentage of Population Employed in Arts, Entertainment & Recreation in Michigan is 1.8%.
What is the Percentage of Population Employed in Arts, Entertainment & Recreation in the United States?
Percentage of Population Employed in Arts, Entertainment & Recreation in the United States is 2.1%.