Zip Codes with the Highest Percentage of Population Employed in Farming, Fishing & Forestry in Portage, MI
RELATED REPORTS & OPTIONS
Farming, Fishing & Forestry
Portage
Compare Zip Codes
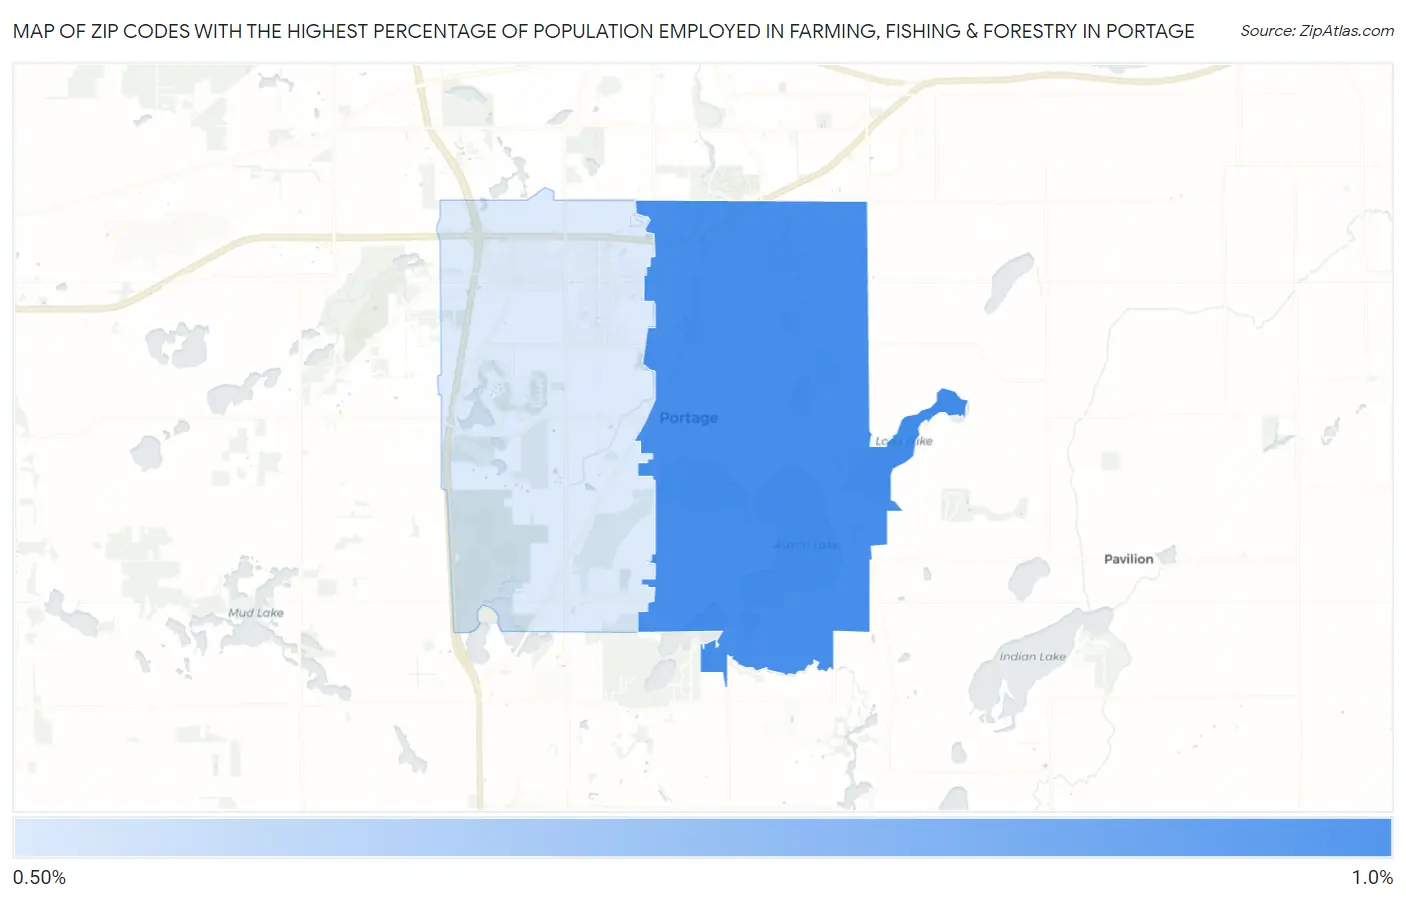
Map of Zip Codes with the Highest Percentage of Population Employed in Farming, Fishing & Forestry in Portage
0.0%
1.0%
Zip Codes with the Highest Percentage of Population Employed in Farming, Fishing & Forestry in Portage, MI
| Zip Code | % Employed | vs State | vs National | |
| 1. | 49002 | 0.88% | 0.47%(+0.416)#313 | 0.61%(+0.277)#10,316 |
| 2. | 49024 | 0.50% | 0.47%(+0.035)#421 | 0.61%(-0.104)#12,825 |
1
Common Questions
What are the Top Zip Codes with the Highest Percentage of Population Employed in Farming, Fishing & Forestry in Portage, MI?
Top Zip Codes with the Highest Percentage of Population Employed in Farming, Fishing & Forestry in Portage, MI are:
What zip code has the Highest Percentage of Population Employed in Farming, Fishing & Forestry in Portage, MI?
49002 has the Highest Percentage of Population Employed in Farming, Fishing & Forestry in Portage, MI with 0.88%.
What is the Percentage of Population Employed in Farming, Fishing & Forestry in Portage, MI?
Percentage of Population Employed in Farming, Fishing & Forestry in Portage is 0.66%.
What is the Percentage of Population Employed in Farming, Fishing & Forestry in Michigan?
Percentage of Population Employed in Farming, Fishing & Forestry in Michigan is 0.47%.
What is the Percentage of Population Employed in Farming, Fishing & Forestry in the United States?
Percentage of Population Employed in Farming, Fishing & Forestry in the United States is 0.61%.