Zip Codes with the Highest Poverty Level in Oxford, MI
On this page
RELATED REPORTS & OPTIONS
Highest Poverty
Population
Highest PopulationHighest Population DensityLowest Population DensityMale / Female RatioFemale / Male RatioOldest PopulationOldest Population | MaleOldest Population | FemaleYoungest PopulationYoungest Population | MaleYoungest Population | Female
Families and Households
Largest Family SizeLargest Household SizeMost Single FathersFewest Single FathersSmallest Family SizeSmallest Household Size
Female Fertility
Highest Birth Rate | All WomenHighest Birth Rate | Women 35+Highest Birth Rate | Below PovertyHighest Birth Rate | Public IncomeHighest Birth Rate | In Labor ForceLowest Birth Rate | All WomenLowest Birth Rate | Women 35+Lowest Birth Rate | Below PovertyLowest Birth Rate | Public IncomeLowest Birth Rate | In Labor Force
Race (Community Size)
Race (Percentage)
Ancestry (Community Size)
AmericanAssyrian / Chaldean / SyriacBelgianBritishCanadianEastern EuropeanEnglishEuropeanFinnishFrenchFrench CanadianGermanHungarianIrishItalianKoreanLithuanianMexicanPolishRussianScandinavianScotch-IrishScottishSlovakSwedishUkrainianWelsh
Ancestry (Percentage)
AmericanAssyrian / Chaldean / SyriacBelgianBritishCanadianEastern EuropeanEnglishEuropeanFinnishFrenchFrench CanadianGermanHungarianIrishItalianKoreanLithuanianMexicanPolishRussianScandinavianScotch-IrishScottishSlovakSwedishUkrainianWelsh
Immigrant Origin (Total)
AsiaCanadaCentral AmericaEastern EuropeEuropeGermanyLatin AmericaMexicoPhilippinesSouth Eastern AsiaWestern Europe
Immigrant Origin (Percentage)
AsiaCanadaCentral AmericaEastern EuropeEuropeGermanyLatin AmericaMexicoPhilippinesSouth Eastern AsiaWestern Europe
Income
Highest Per Capita IncomeHighest Earnings | MaleHighest Earnings | FemaleHighest Wage/Income Gap ($)Highest Wage/Income Gap (%)Highest Inequality / Gini IndexLowest Per Capita IncomeLowest Earnings | MaleLowest Earnings | FemaleLowest Wage/Income Gap ($)Lowest Wage/Income Gap (%)Lowest Inequality / Gini Index
Income (Families)
Income (Households)
Highest Household IncomeLowest Household IncomeHousehold Income | $0-10kHousehold Income | $200k+Household Income | $100k+
Poverty
Highest PovertyHighest Poverty | MaleHighest Poverty | FemaleHighest Poverty | Child 0-16Highest Poverty | Boys 0-16Highest Poverty | Girls 0-16Highest Poverty | Seniors 65+Highest Poverty | Seniors 75+ Lowest PovertyLowest Poverty | MaleLowest Poverty | FemaleLowest Poverty | Child 0-16Lowest Poverty | Boys 0-16Lowest Poverty | Girls 0-16Lowest Poverty | Seniors 65+Lowest Poverty | Seniors 75+
Poverty (Families)
Highest Family PovertyHighest Poverty | Single MaleLowest Family PovertyLowest Poverty | Single Male
Unemployment
Highest UnemploymentHighest Unemployment | FemaleHighest Unemployment | Youth < 25Lowest UnemploymentLowest Unemployment | FemaleLowest Unemployment | Youth < 25
Employment Occupations
Architecture & EngineeringBusiness & FinancialCleaning & MaintenanceCommunity & Social Service Computer & MathematicsComputer, Engineering & ScienceConstruction & ExtractionEducation Instruction & LibraryEducation, Arts & MediaFood Preparation & ServingHealth Diagnosing & TreatingHealth TechnologistsHealthcare SupportInstallation, Maintenance & RepairLegal Services & SupportManagementMaterial MovingOffice & AdministrationPersonal Care and ServiceProductionSales & RelatedTransportation
Employment Industries
Accommodation & Food ServicesAdministrative & Support ServicesAgriculture, Fishing & HuntingArts, Entertainment & RecreationConstructionEducational ServicesHealth Care & Social AssistanceManufacturingProfessional & Scientific ServicesPublic AdministrationReal Estate, Rental & LeasingRetail TradeTransportation & WarehousingWholesale Trade
Employer Class
Private Company EmployeesSelf-Employed / IncorporatedSelf-Employed / Not IncorporatedNot-for-profit OrganizationsLocal Government EmployeesState Government EmployeesFederal Government Employees
Commute Time
Longest CommuteLongest Commute | MaleLongest Commute | FemaleShortest CommuteShortest Commute | MaleShortest Commute | Female
Commute Means
School Enrollment
In Private SchoolNursery / PreschoolKindergartenElementary SchoolMiddle SchoolHigh SchoolCollegeUniversity
Education by Degree Field
Bio, Nature & AgriculturalPhysical and Health SciencesPsychologySocial SciencesEngineeringScience and EngineeringBusinessEducationLiterature and LanguagesLiberal Arts and HistoryCommunicationsArts and Humanities
Occupancy
Finances
Highest Median Housing CostsHighest Property PricesHighest Owner Housing CostsHighest Housing Costs / IncomeLowest Median Housing CostsLowest Property PricesLowest Owner Housing CostsLowest Housing Costs / Income
Physical Characteristics
Oxford
States
AlabamaAlaskaArizonaArkansasCaliforniaColoradoConnecticutDelawareDistrict Of ColumbiaFloridaGeorgiaHawaiiIdahoIllinoisIndianaIowaKansasKentuckyLouisianaMaineMarylandMassachusettsMichiganMinnesotaMississippiMissouriMontanaNebraskaNevadaNew HampshireNew JerseyNew MexicoNew YorkNorth CarolinaNorth DakotaOhioOklahomaOregonPennsylvaniaPuerto RicoRhode IslandSouth CarolinaSouth DakotaTennesseeTexasUtahVermontVirginiaWashingtonWest VirginiaWisconsinWyoming
Michigan Cities
Ann ArborBattle CreekBay CityBloomfield HillsBrightonBurtonCantonClarkstonClinton TownshipDearbornDearborn HeightsDetroitFarmingtonFlintGrand RapidsGrosse PointeHighlandHollandHowellJacksonKalamazooLake OrionLansingLivoniaMacombMidlandMilfordMonroeMount PleasantMuskegonNew BaltimoreNew HavenNorthvilleNoviOxfordPontiacPortageRedfordRochesterRoyal OakSaginawSaint Clair ShoresSouthfieldSterling HeightsTraverse CityTroyUticaWarrenWashingtonWaterfordWest BloomfieldWestlandWhite LakeWyomingYpsilanti
Compare Zip Codes
Comparison Subject
Compare StatesCompare CitiesCompare Zip Codes
Map of Zip Codes with the Highest Poverty Level in Oxford
0.0%
5.0%
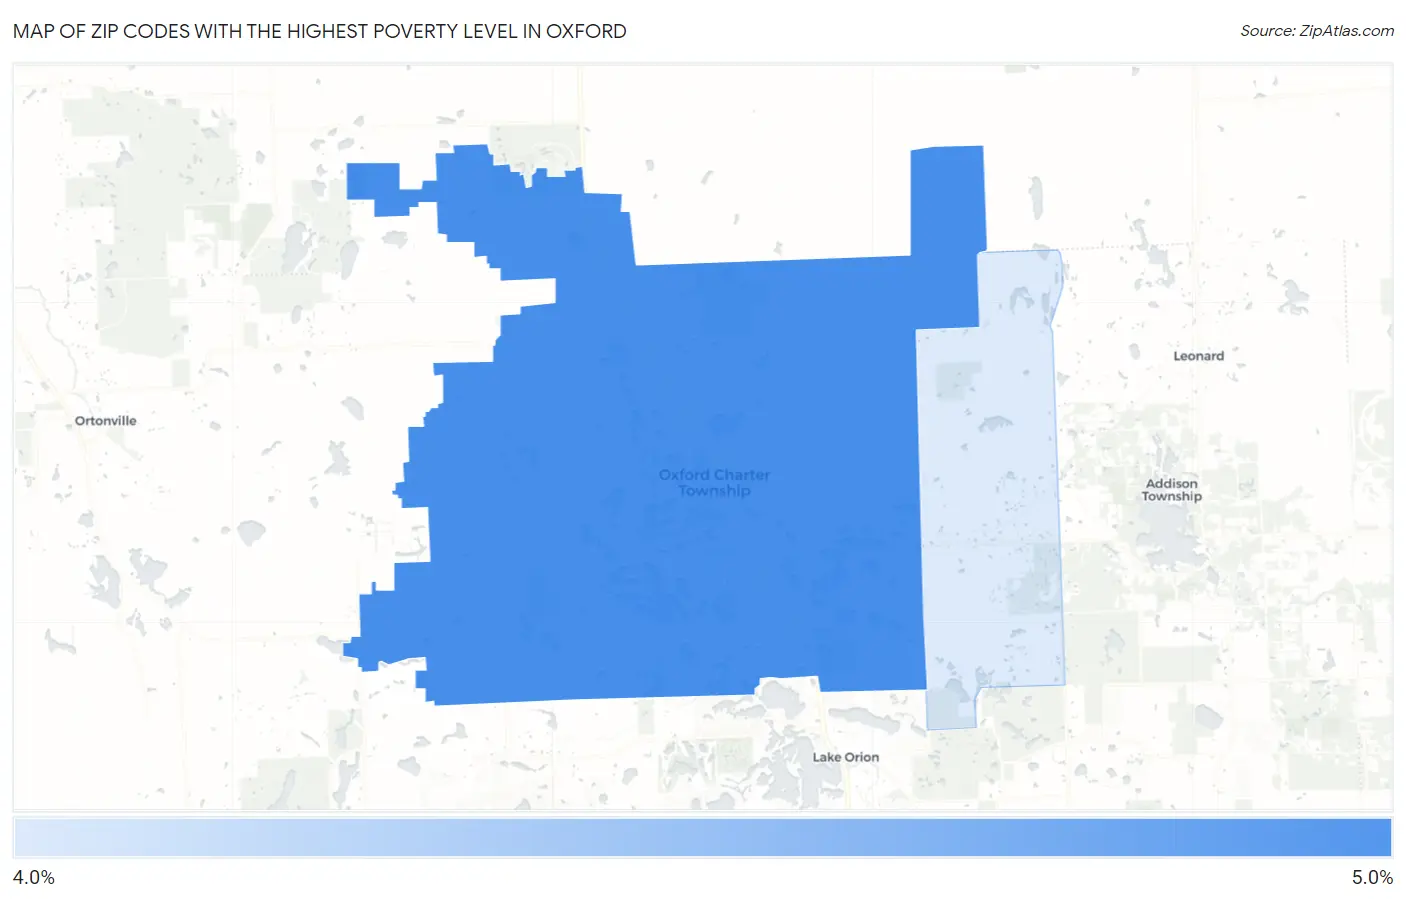
Zip Codes with the Highest Poverty Level in Oxford, MI
| Zip Code | Poverty | vs State | vs National | |
| 1. | 48371 | 4.7% | 13.1%(-8.43)#853 | 12.5%(-7.83)#26,847 |
| 2. | 48370 | 4.1% | 13.1%(-9.08)#882 | 12.5%(-8.48)#27,898 |
1
Common Questions
What are the Top Zip Codes with the Highest Poverty Level in Oxford, MI?
Top Zip Codes with the Highest Poverty Level in Oxford, MI are:
What zip code has the Highest Poverty Level in Oxford, MI?
48371 has the Highest Poverty Level in Oxford, MI with 4.7%.
What is the Poverty Level in Oxford, MI?
Poverty Level in Oxford is 5.9%.
What is the Poverty Level in Michigan?
Poverty Level in Michigan is 13.1%.
What is the Poverty Level in the United States?
Poverty Level in the United States is 12.5%.