Zip Codes with the Highest Percentage of Population Employed in Agriculture, Fishing & Hunting in New Baltimore, MI
RELATED REPORTS & OPTIONS
Agriculture, Fishing & Hunting
New Baltimore
Compare Zip Codes
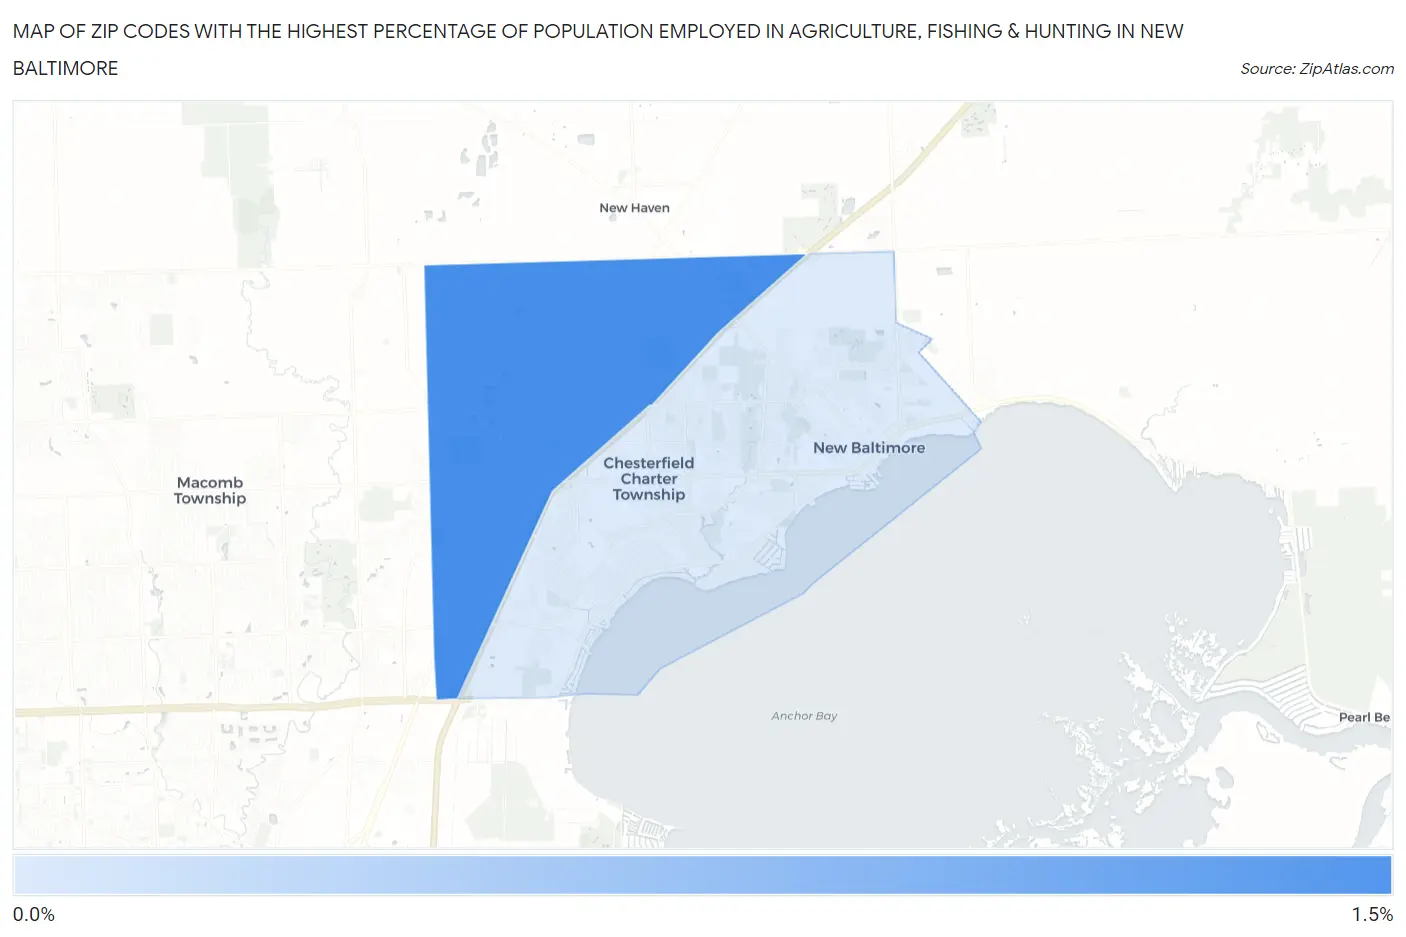
Map of Zip Codes with the Highest Percentage of Population Employed in Agriculture, Fishing & Hunting in New Baltimore
0.0%
1.5%
Zip Codes with the Highest Percentage of Population Employed in Agriculture, Fishing & Hunting in New Baltimore, MI
| Zip Code | % Employed | vs State | vs National | |
| 1. | 48051 | 1.0% | 0.98%(+0.059)#504 | 1.2%(-0.156)#16,035 |
| 2. | 48047 | 0.15% | 0.98%(-0.836)#771 | 1.2%(-1.05)#23,046 |
1
Common Questions
What are the Top Zip Codes with the Highest Percentage of Population Employed in Agriculture, Fishing & Hunting in New Baltimore, MI?
Top Zip Codes with the Highest Percentage of Population Employed in Agriculture, Fishing & Hunting in New Baltimore, MI are:
What zip code has the Highest Percentage of Population Employed in Agriculture, Fishing & Hunting in New Baltimore, MI?
48051 has the Highest Percentage of Population Employed in Agriculture, Fishing & Hunting in New Baltimore, MI with 1.0%.
What is the Percentage of Population Employed in Agriculture, Fishing & Hunting in New Baltimore, MI?
Percentage of Population Employed in Agriculture, Fishing & Hunting in New Baltimore is 0.12%.
What is the Percentage of Population Employed in Agriculture, Fishing & Hunting in Michigan?
Percentage of Population Employed in Agriculture, Fishing & Hunting in Michigan is 0.98%.
What is the Percentage of Population Employed in Agriculture, Fishing & Hunting in the United States?
Percentage of Population Employed in Agriculture, Fishing & Hunting in the United States is 1.2%.