Zip Codes with the Highest Percentage of Population Employed in Agriculture, Fishing & Hunting in Milford, MI
RELATED REPORTS & OPTIONS
Agriculture, Fishing & Hunting
Milford
Compare Zip Codes
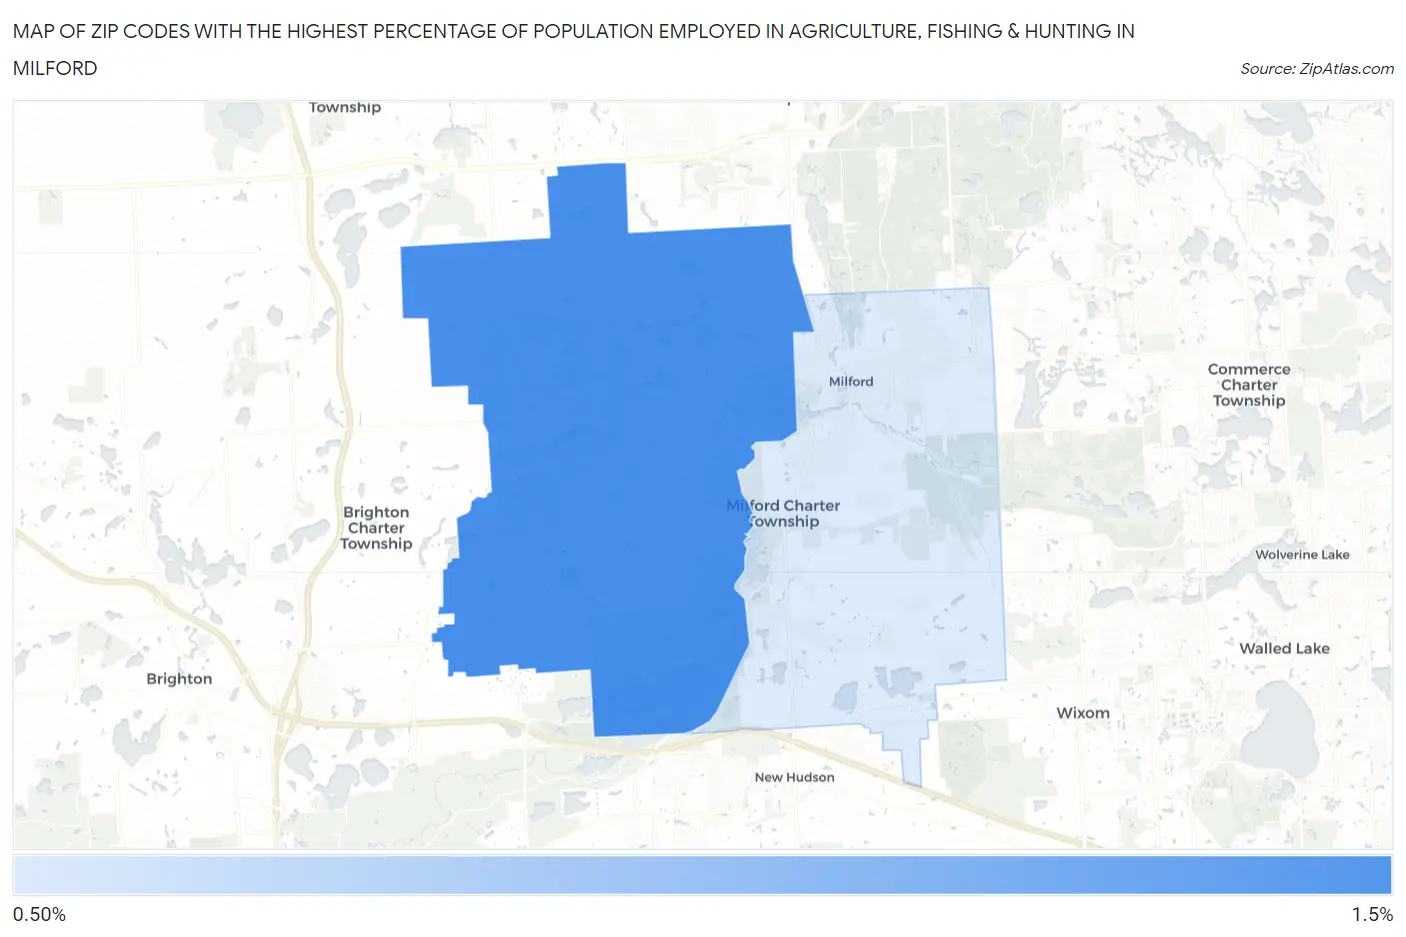
Map of Zip Codes with the Highest Percentage of Population Employed in Agriculture, Fishing & Hunting in Milford
0.0%
1.5%
Zip Codes with the Highest Percentage of Population Employed in Agriculture, Fishing & Hunting in Milford, MI
| Zip Code | % Employed | vs State | vs National | |
| 1. | 48380 | 1.4% | 0.98%(+0.392)#440 | 1.2%(+0.177)#14,738 |
| 2. | 48381 | 0.68% | 0.98%(-0.307)#583 | 1.2%(-0.522)#17,971 |
1
Common Questions
What are the Top Zip Codes with the Highest Percentage of Population Employed in Agriculture, Fishing & Hunting in Milford, MI?
Top Zip Codes with the Highest Percentage of Population Employed in Agriculture, Fishing & Hunting in Milford, MI are:
What zip code has the Highest Percentage of Population Employed in Agriculture, Fishing & Hunting in Milford, MI?
48380 has the Highest Percentage of Population Employed in Agriculture, Fishing & Hunting in Milford, MI with 1.4%.
What is the Percentage of Population Employed in Agriculture, Fishing & Hunting in Michigan?
Percentage of Population Employed in Agriculture, Fishing & Hunting in Michigan is 0.98%.
What is the Percentage of Population Employed in Agriculture, Fishing & Hunting in the United States?
Percentage of Population Employed in Agriculture, Fishing & Hunting in the United States is 1.2%.