Zip Codes with the Highest Percentage of Population Employed in Farming, Fishing & Forestry in Milford, MI
RELATED REPORTS & OPTIONS
Farming, Fishing & Forestry
Milford
Compare Zip Codes
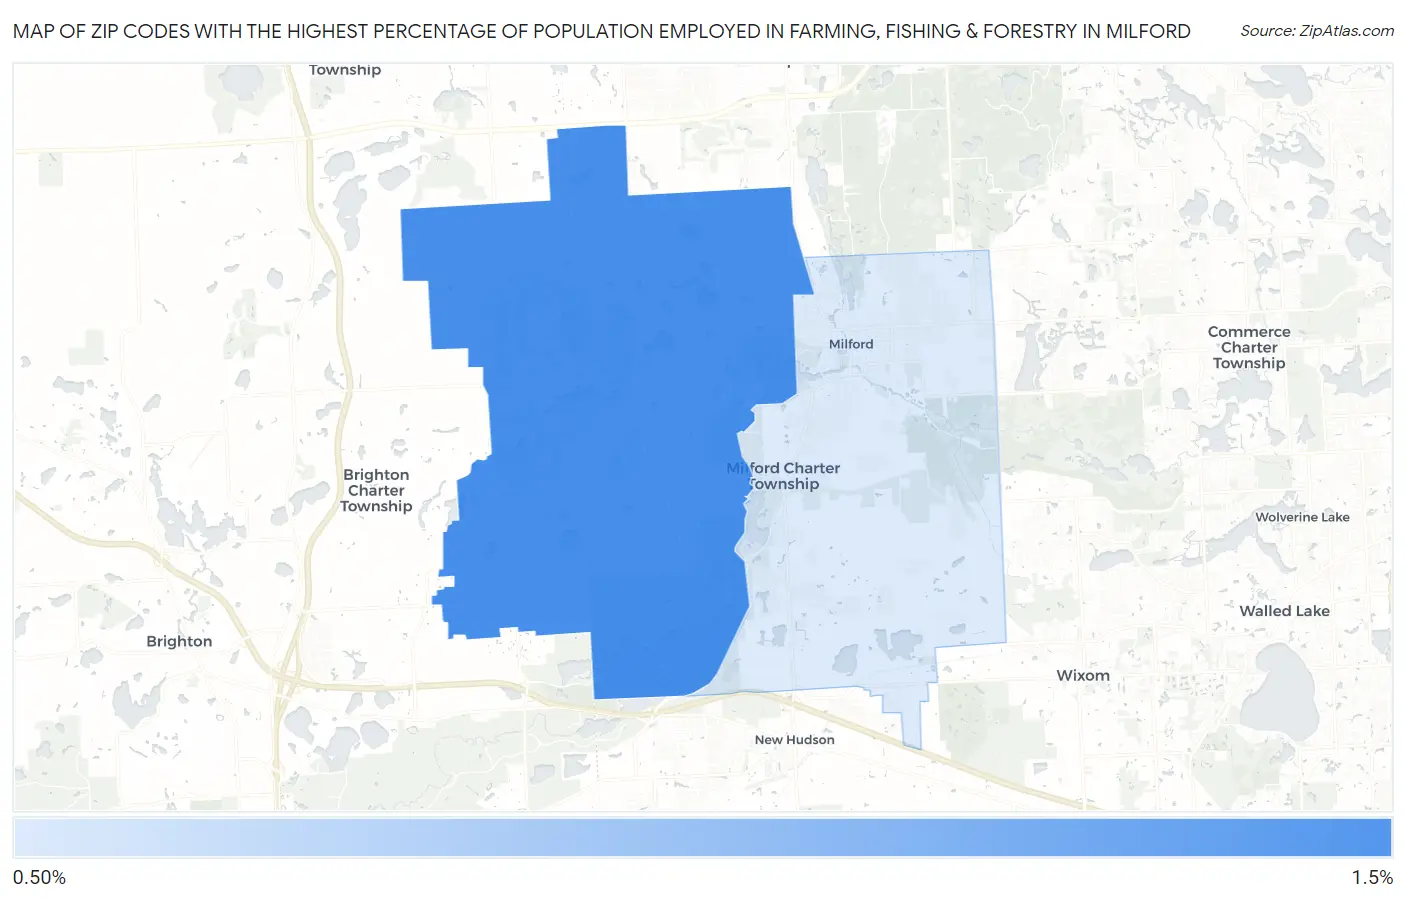
Map of Zip Codes with the Highest Percentage of Population Employed in Farming, Fishing & Forestry in Milford
0.0%
1.5%
Zip Codes with the Highest Percentage of Population Employed in Farming, Fishing & Forestry in Milford, MI
| Zip Code | % Employed | vs State | vs National | |
| 1. | 48380 | 1.1% | 0.47%(+0.662)#263 | 0.61%(+0.523)#9,208 |
| 2. | 48381 | 0.68% | 0.47%(+0.211)#361 | 0.61%(+0.072)#11,534 |
1
Common Questions
What are the Top Zip Codes with the Highest Percentage of Population Employed in Farming, Fishing & Forestry in Milford, MI?
Top Zip Codes with the Highest Percentage of Population Employed in Farming, Fishing & Forestry in Milford, MI are:
What zip code has the Highest Percentage of Population Employed in Farming, Fishing & Forestry in Milford, MI?
48380 has the Highest Percentage of Population Employed in Farming, Fishing & Forestry in Milford, MI with 1.1%.
What is the Percentage of Population Employed in Farming, Fishing & Forestry in Michigan?
Percentage of Population Employed in Farming, Fishing & Forestry in Michigan is 0.47%.
What is the Percentage of Population Employed in Farming, Fishing & Forestry in the United States?
Percentage of Population Employed in Farming, Fishing & Forestry in the United States is 0.61%.