Zip Codes with the Highest Percentage of Black / African American Population in Milford, MI
RELATED REPORTS & OPTIONS
Black / African American
Milford
Compare Zip Codes
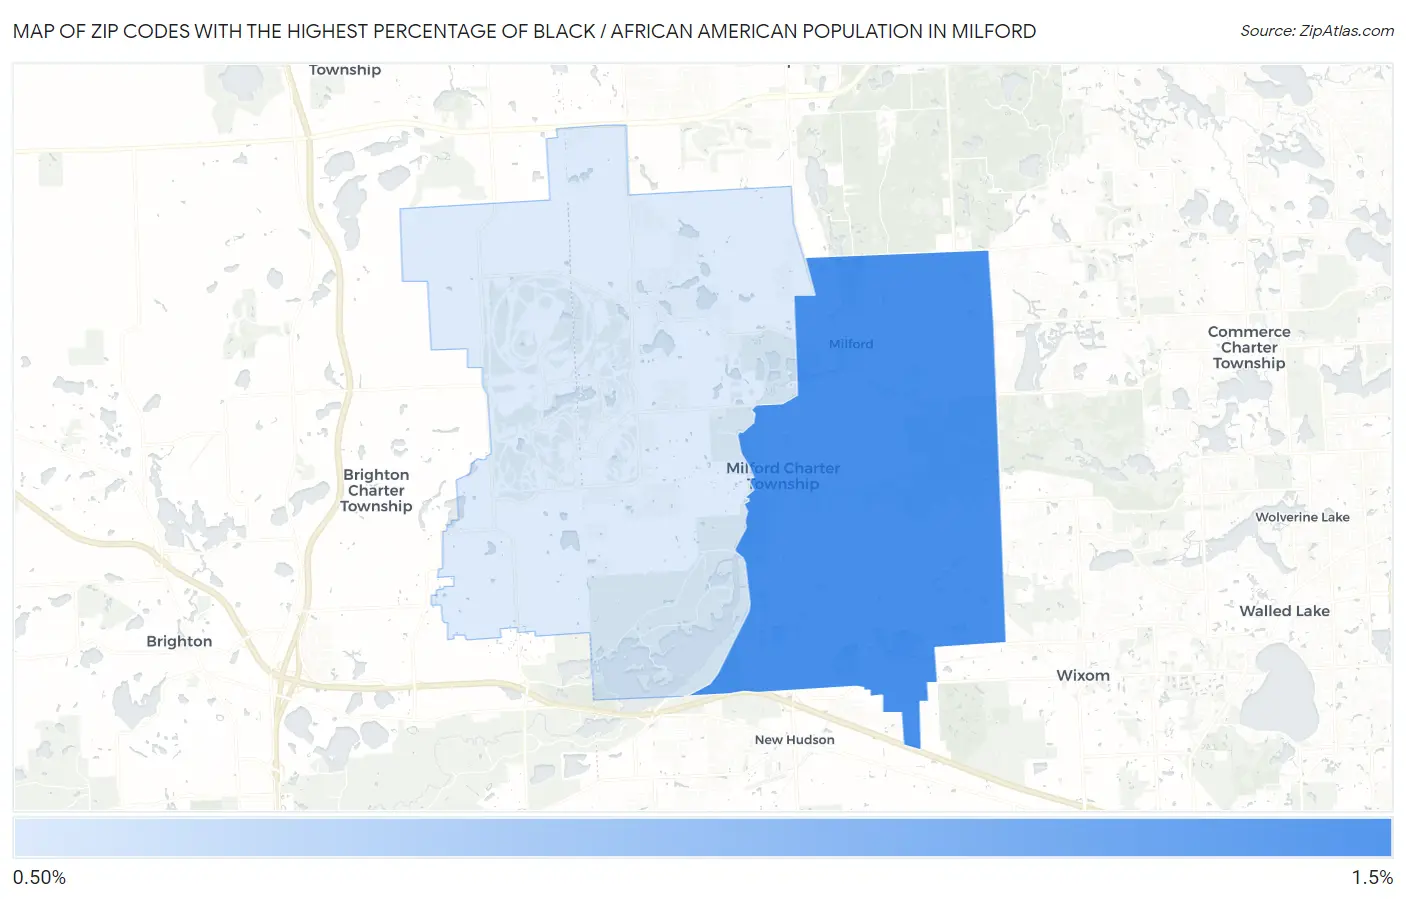
Map of Zip Codes with the Highest Percentage of Black / African American Population in Milford
0.86%
1.1%
Zip Codes with the Highest Percentage of Black / African American Population in Milford, MI
| Zip Code | Black / African American | vs State | vs National | |
| 1. | 48381 | 1.1% | 13.6%(-12.5)#441 | 12.5%(-11.4)#16,233 |
| 2. | 48380 | 0.86% | 13.6%(-12.7)#488 | 12.5%(-11.6)#17,120 |
1
Common Questions
What are the Top Zip Codes with the Highest Percentage of Black / African American Population in Milford, MI?
Top Zip Codes with the Highest Percentage of Black / African American Population in Milford, MI are:
What zip code has the Highest Percentage of Black / African American Population in Milford, MI?
48381 has the Highest Percentage of Black / African American Population in Milford, MI with 1.1%.
What is the Percentage of Black / African American Population in Milford, MI?
Percentage of Black / African American Population in Milford is 1.2%.
What is the Percentage of Black / African American Population in Michigan?
Percentage of Black / African American Population in Michigan is 13.6%.
What is the Percentage of Black / African American Population in the United States?
Percentage of Black / African American Population in the United States is 12.5%.