Zip Codes with the Highest Percentage of Population Employed in Transportation & Warehousing in Macomb, MI
RELATED REPORTS & OPTIONS
Transportation & Warehousing
Macomb
Compare Zip Codes
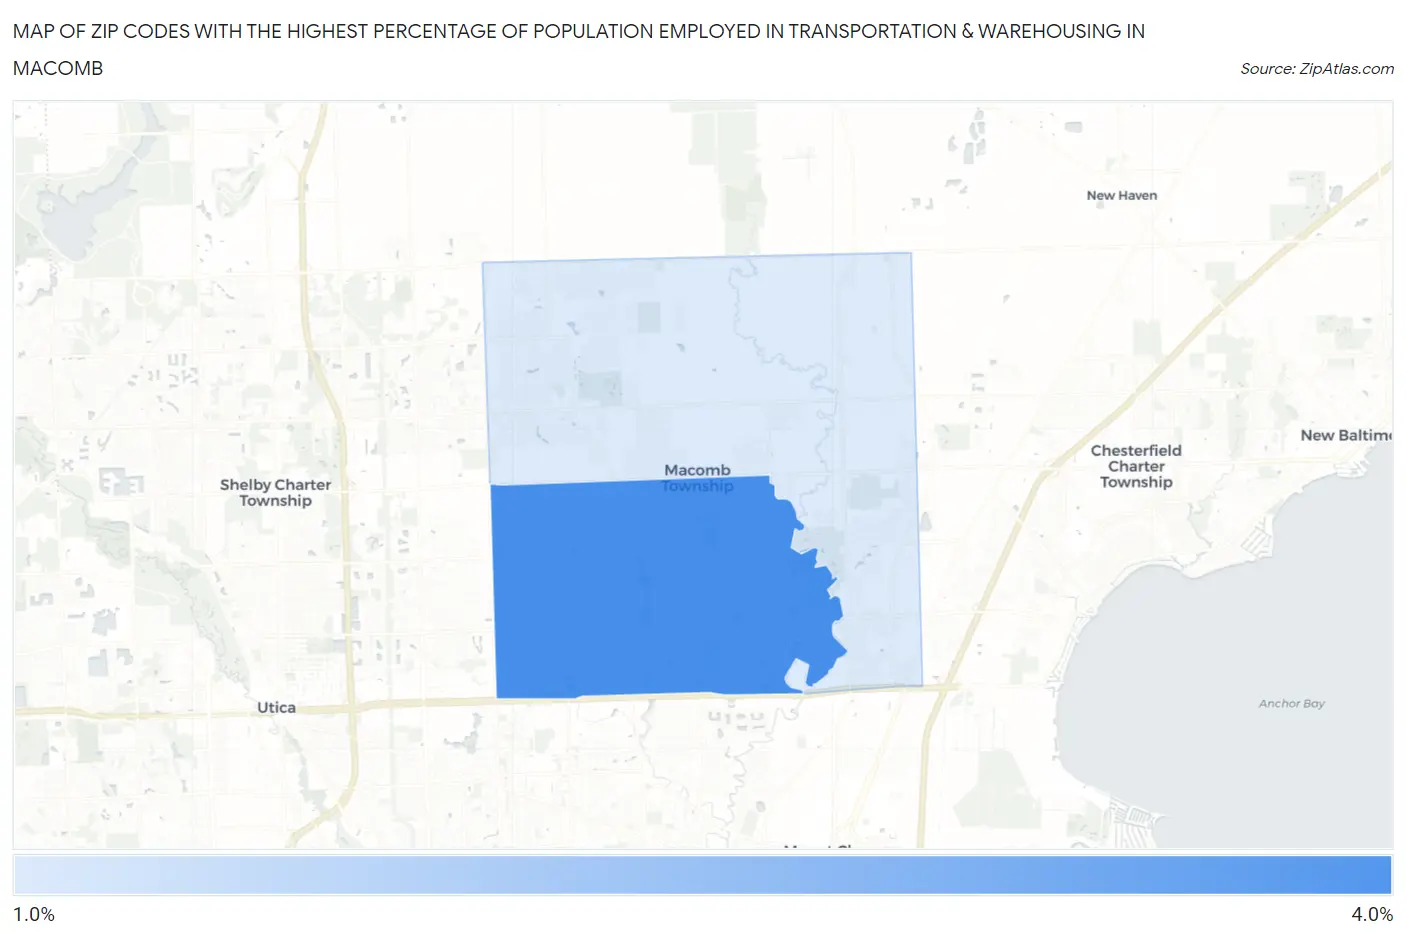
Map of Zip Codes with the Highest Percentage of Population Employed in Transportation & Warehousing in Macomb
0.0%
4.0%
Zip Codes with the Highest Percentage of Population Employed in Transportation & Warehousing in Macomb, MI
| Zip Code | % Employed | vs State | vs National | |
| 1. | 48044 | 3.3% | 3.9%(-0.649)#530 | 4.9%(-1.69)#19,092 |
| 2. | 48042 | 1.7% | 3.9%(-2.16)#810 | 4.9%(-3.20)#25,120 |
1
Common Questions
What are the Top Zip Codes with the Highest Percentage of Population Employed in Transportation & Warehousing in Macomb, MI?
Top Zip Codes with the Highest Percentage of Population Employed in Transportation & Warehousing in Macomb, MI are:
What zip code has the Highest Percentage of Population Employed in Transportation & Warehousing in Macomb, MI?
48044 has the Highest Percentage of Population Employed in Transportation & Warehousing in Macomb, MI with 3.3%.
What is the Percentage of Population Employed in Transportation & Warehousing in Michigan?
Percentage of Population Employed in Transportation & Warehousing in Michigan is 3.9%.
What is the Percentage of Population Employed in Transportation & Warehousing in the United States?
Percentage of Population Employed in Transportation & Warehousing in the United States is 4.9%.