Zip Codes with the Highest Percentage of Population Employed in Agriculture, Fishing & Hunting in Livonia, MI
RELATED REPORTS & OPTIONS
Agriculture, Fishing & Hunting
Livonia
Compare Zip Codes
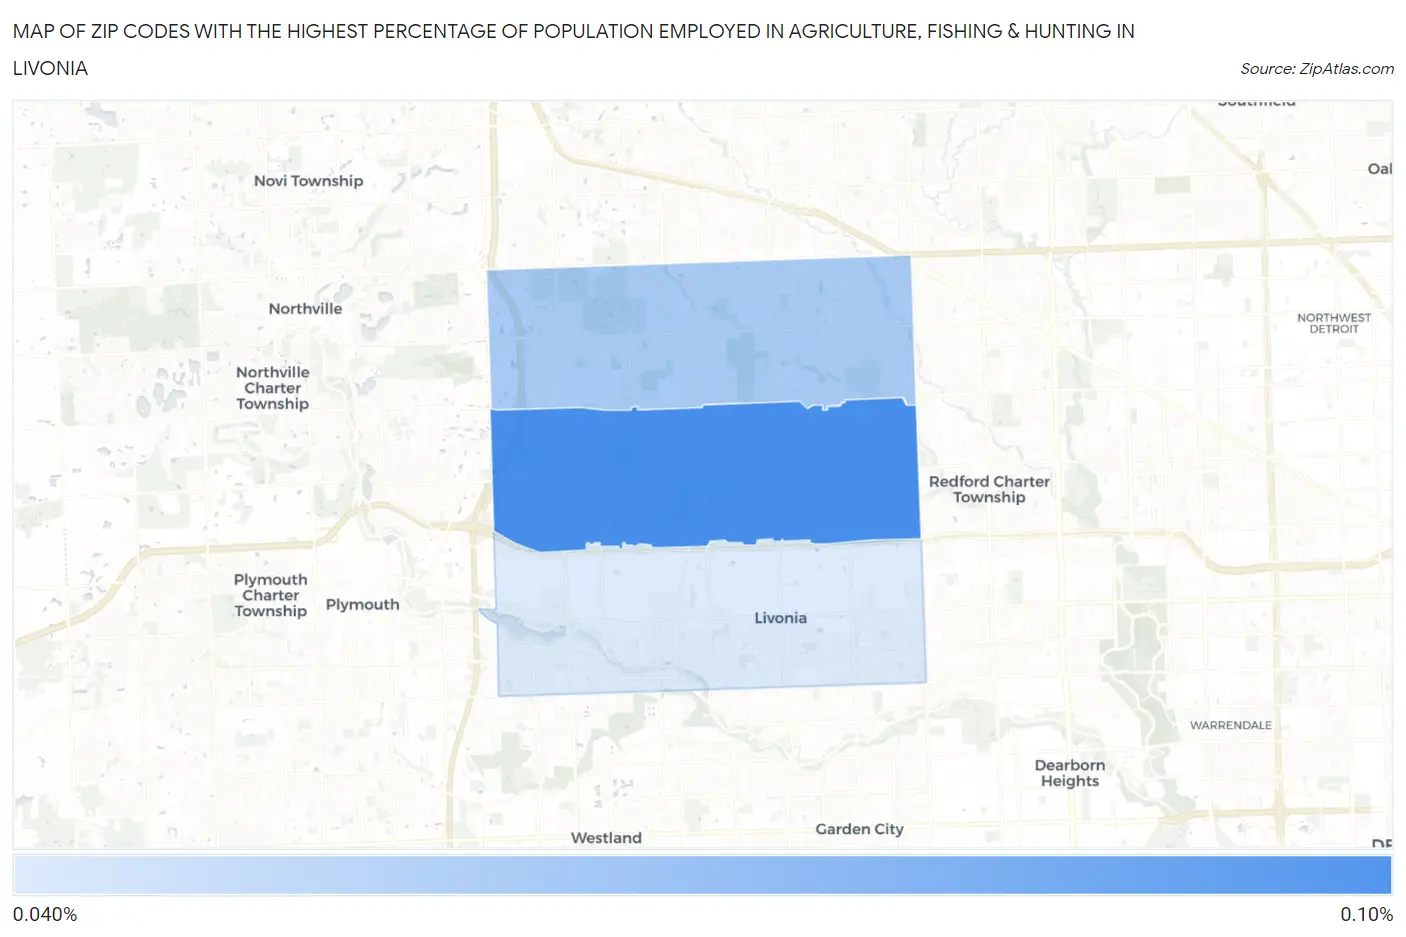
Map of Zip Codes with the Highest Percentage of Population Employed in Agriculture, Fishing & Hunting in Livonia
0.0%
0.10%
Zip Codes with the Highest Percentage of Population Employed in Agriculture, Fishing & Hunting in Livonia, MI
| Zip Code | % Employed | vs State | vs National | |
| 1. | 48154 | 0.099% | 0.98%(-0.885)#793 | 1.2%(-1.10)#23,698 |
| 2. | 48152 | 0.066% | 0.98%(-0.918)#802 | 1.2%(-1.13)#24,160 |
| 3. | 48150 | 0.048% | 0.98%(-0.936)#813 | 1.2%(-1.15)#24,369 |
1
Common Questions
What are the Top Zip Codes with the Highest Percentage of Population Employed in Agriculture, Fishing & Hunting in Livonia, MI?
Top Zip Codes with the Highest Percentage of Population Employed in Agriculture, Fishing & Hunting in Livonia, MI are:
What zip code has the Highest Percentage of Population Employed in Agriculture, Fishing & Hunting in Livonia, MI?
48154 has the Highest Percentage of Population Employed in Agriculture, Fishing & Hunting in Livonia, MI with 0.099%.
What is the Percentage of Population Employed in Agriculture, Fishing & Hunting in Livonia, MI?
Percentage of Population Employed in Agriculture, Fishing & Hunting in Livonia is 0.073%.
What is the Percentage of Population Employed in Agriculture, Fishing & Hunting in Michigan?
Percentage of Population Employed in Agriculture, Fishing & Hunting in Michigan is 0.98%.
What is the Percentage of Population Employed in Agriculture, Fishing & Hunting in the United States?
Percentage of Population Employed in Agriculture, Fishing & Hunting in the United States is 1.2%.