Zip Codes with the Highest Percentage of Population Employed in Professional & Scientific Services in Lansing, MI

RELATED REPORTS & OPTIONS

Professional & Scientific Services
Population
Families and Households
Female Fertility
Female Fertility (Unmarried)
Race (Community Size)
Race (Percentage)
Ancestry (Community Size)
AfghanAfricanAmericanApacheArabArgentineanArmenianAustrianBangladeshiBelgianBhutaneseBlackfeetBrazilianBritishBritish West IndianBurmeseCanadianCentral AmericanCentral American IndianCherokeeChippewaChoctawColombianCreeCroatianCubanCzechCzechoslovakianDanishDominicanDutchEastern EuropeanEcuadorianEgyptianEnglishEthiopianEuropeanFinnishFrenchFrench American IndianFrench CanadianGermanGhanaianGreekGuatemalanHaitianHonduranHungarianIndian (Asian)IndonesianIranianIraqiIrishIroquoisItalianJamaicanKenyanKoreanLaotianLatvianLebaneseLithuanianLuxembourgerMacedonianMalaysianMalteseMexicanMexican American IndianMoroccanNative HawaiianNavajoNigerianNorthern EuropeanNorwegianOttawaPakistaniPalestinianPennsylvania GermanPeruvianPolishPortuguesePotawatomiPuerto RicanRomanianRussianSalvadoranSamoanScandinavianScotch-IrishScottishSerbianSiouxSlavicSlovakSloveneSomaliSouth AmericanSpaniardSpanishSpanish AmericanSri LankanSubsaharan AfricanSudaneseSwedishSwissSyrianThaiTrinidadian and TobagonianUkrainianVenezuelanWelshWest IndianYugoslavian
Ancestry (Percentage)
AfghanAfricanAmericanApacheArabArgentineanArmenianAustrianBangladeshiBelgianBhutaneseBlackfeetBrazilianBritishBritish West IndianBurmeseCanadianCentral AmericanCentral American IndianCherokeeChippewaChoctawColombianCreeCroatianCubanCzechCzechoslovakianDanishDominicanDutchEastern EuropeanEcuadorianEgyptianEnglishEthiopianEuropeanFinnishFrenchFrench American IndianFrench CanadianGermanGhanaianGreekGuatemalanHaitianHonduranHungarianIndian (Asian)IndonesianIranianIraqiIrishIroquoisItalianJamaicanKenyanKoreanLaotianLatvianLebaneseLithuanianLuxembourgerMacedonianMalaysianMalteseMexicanMexican American IndianMoroccanNative HawaiianNavajoNigerianNorthern EuropeanNorwegianOttawaPakistaniPalestinianPennsylvania GermanPeruvianPolishPortuguesePotawatomiPuerto RicanRomanianRussianSalvadoranSamoanScandinavianScotch-IrishScottishSerbianSiouxSlavicSlovakSloveneSomaliSouth AmericanSpaniardSpanishSpanish AmericanSri LankanSubsaharan AfricanSudaneseSwedishSwissSyrianThaiTrinidadian and TobagonianUkrainianVenezuelanWelshWest IndianYugoslavian
Immigrant Origin (Total)
Immigrant Origin (Percentage)
Income
Income (Families)
Income (Households)
Poverty
Poverty (Families)
Unemployment
Employment Occupations
Employment Industries
Employer Class
Commute Time
Commute Means
School Enrollment
Education by Degree Field
Occupancy
Finances
Physical Characteristics
Lansing
Compare Zip Codes
Comparison Subject

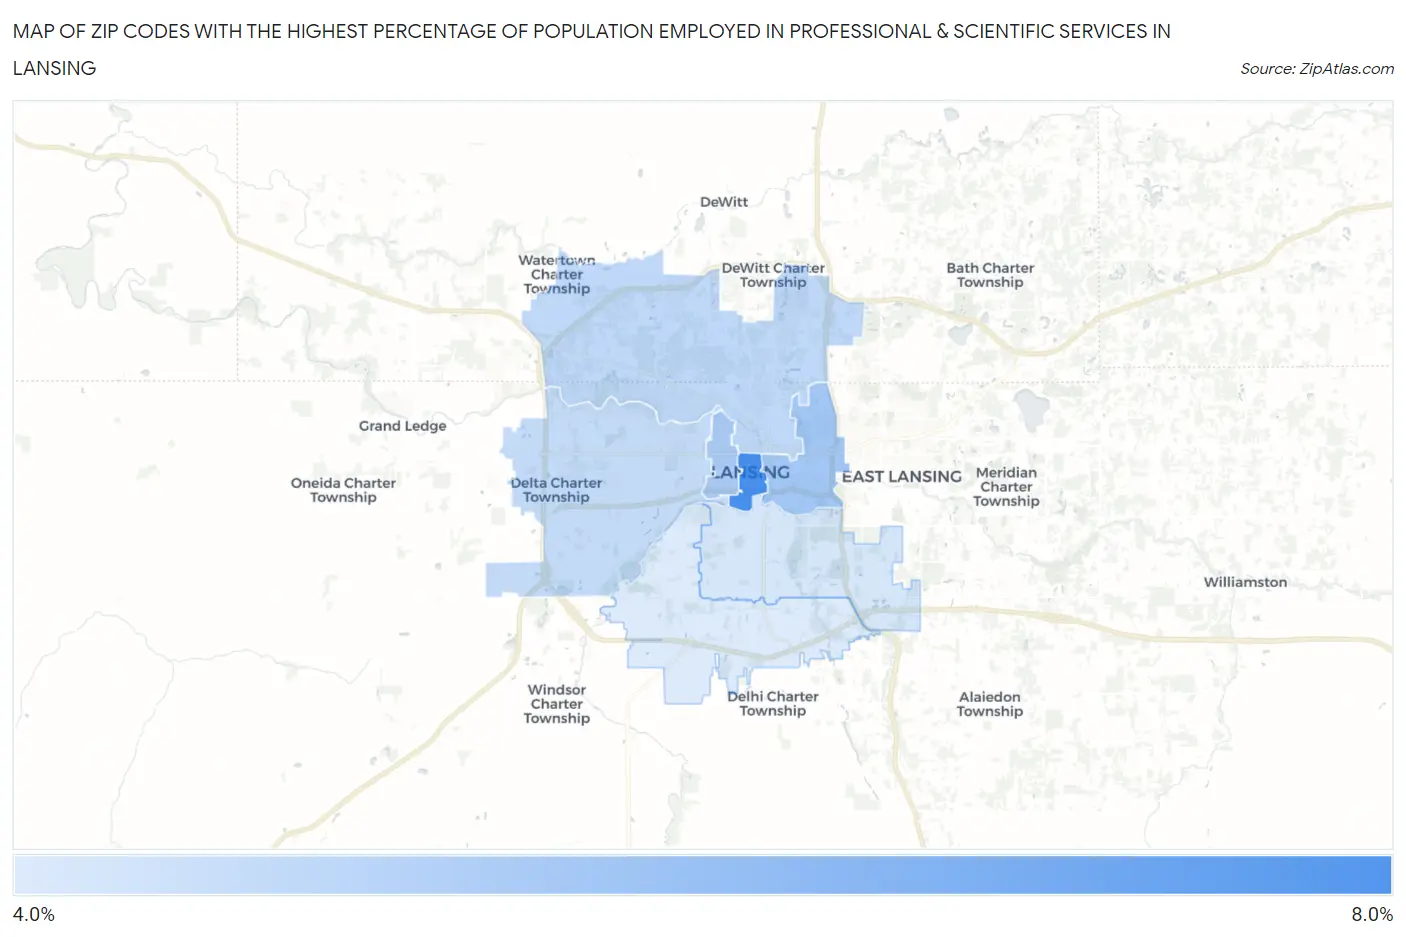
Map of Zip Codes with the Highest Percentage of Population Employed in Professional & Scientific Services in Lansing

0.0%
8.0%
Zip Codes with the Highest Percentage of Population Employed in Professional & Scientific Services in Lansing Map

Zip Codes with the Highest Percentage of Population Employed in Professional & Scientific Services in Lansing, MI

Zip Code % Employed vs State vs National
1.489337.9%6.0%(+1.90)#1317.8%(+0.060)#6,784
2.489125.9%6.0%(-0.150)#2347.8%(-1.99)#10,248
3.489155.7%6.0%(-0.324)#2537.8%(-2.17)#10,625
4.489065.2%6.0%(-0.761)#3017.8%(-2.60)#11,691
5.489175.1%6.0%(-0.893)#3147.8%(-2.73)#12,043
6.489104.7%6.0%(-1.29)#3547.8%(-3.13)#13,070
7.489114.6%6.0%(-1.43)#3717.8%(-3.27)#13,425

Common Questions

What are the Top 5 Zip Codes with the Highest Percentage of Population Employed in Professional & Scientific Services in Lansing, MI?
Top 5 Zip Codes with the Highest Percentage of Population Employed in Professional & Scientific Services in Lansing, MI are:
#1
7.9%
#2
5.9%
#3
5.7%
#4
5.2%
#5
5.1%
What zip code has the Highest Percentage of Population Employed in Professional & Scientific Services in Lansing, MI?
48933 has the Highest Percentage of Population Employed in Professional & Scientific Services in Lansing, MI with 7.9%.
What is the Percentage of Population Employed in Professional & Scientific Services in Lansing, MI?
Percentage of Population Employed in Professional & Scientific Services in Lansing is 4.9%.
What is the Percentage of Population Employed in Professional & Scientific Services in Michigan?
Percentage of Population Employed in Professional & Scientific Services in Michigan is 6.0%.
What is the Percentage of Population Employed in Professional & Scientific Services in the United States?
Percentage of Population Employed in Professional & Scientific Services in the United States is 7.8%.