Zip Codes with the Highest Percentage of Population Employed in Agriculture, Fishing & Hunting in Lansing, MI
RELATED REPORTS & OPTIONS
Agriculture, Fishing & Hunting
Lansing
Compare Zip Codes
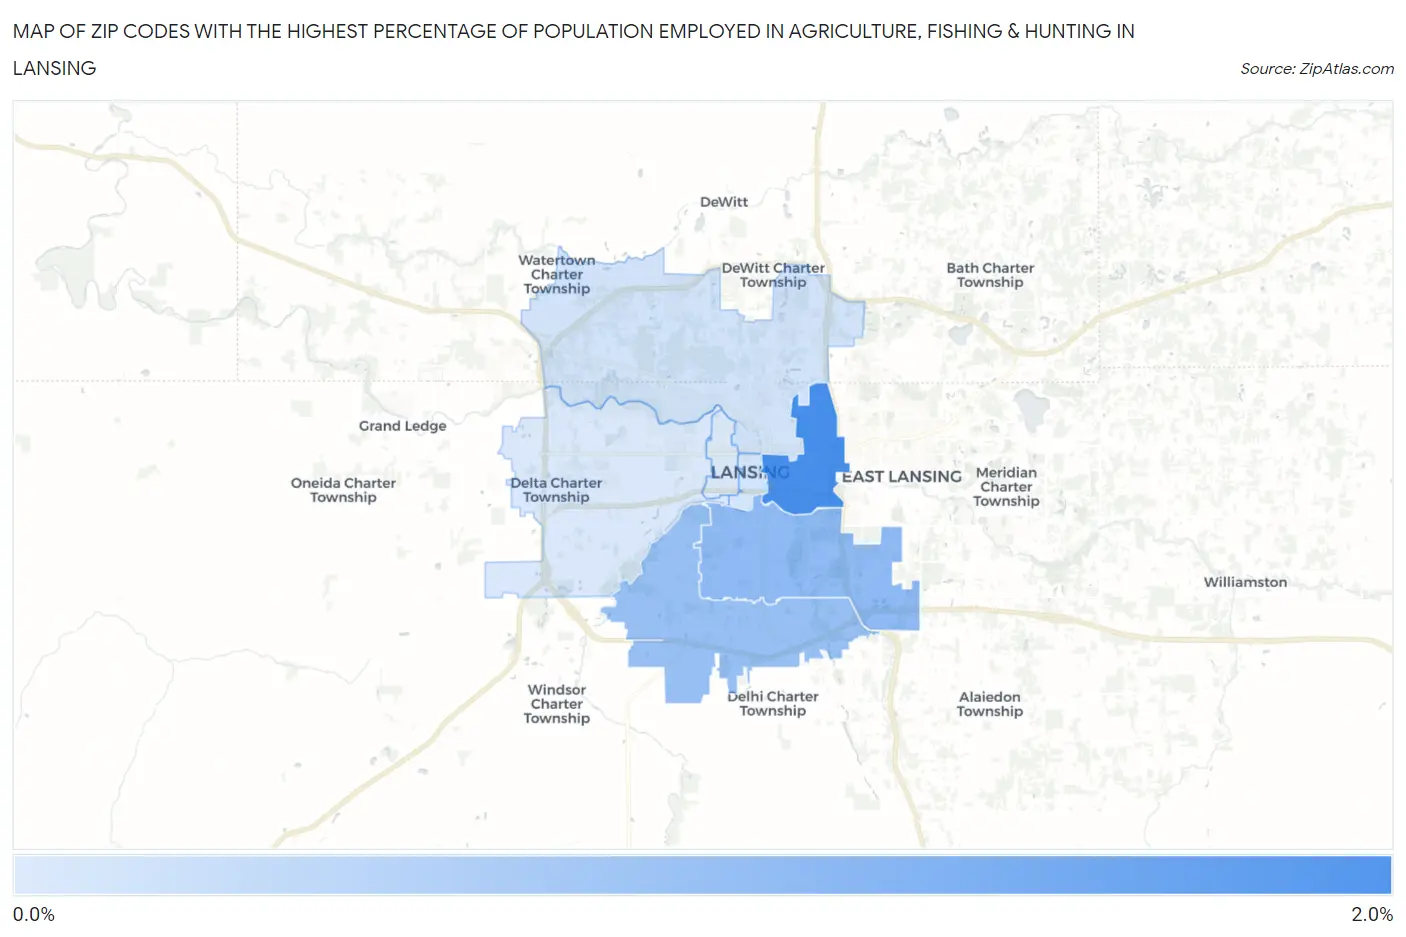
Map of Zip Codes with the Highest Percentage of Population Employed in Agriculture, Fishing & Hunting in Lansing
0.0%
2.0%
Zip Codes with the Highest Percentage of Population Employed in Agriculture, Fishing & Hunting in Lansing, MI
| Zip Code | % Employed | vs State | vs National | |
| 1. | 48912 | 1.7% | 0.98%(+0.699)#394 | 1.2%(+0.484)#13,693 |
| 2. | 48910 | 0.96% | 0.98%(-0.023)#524 | 1.2%(-0.239)#16,400 |
| 3. | 48911 | 0.87% | 0.98%(-0.116)#541 | 1.2%(-0.331)#16,888 |
| 4. | 48906 | 0.31% | 0.98%(-0.678)#697 | 1.2%(-0.893)#21,107 |
| 5. | 48933 | 0.28% | 0.98%(-0.704)#710 | 1.2%(-0.919)#21,410 |
| 6. | 48917 | 0.22% | 0.98%(-0.767)#736 | 1.2%(-0.983)#22,144 |
| 7. | 48915 | 0.19% | 0.98%(-0.797)#749 | 1.2%(-1.01)#22,508 |
1
Common Questions
What are the Top 5 Zip Codes with the Highest Percentage of Population Employed in Agriculture, Fishing & Hunting in Lansing, MI?
Top 5 Zip Codes with the Highest Percentage of Population Employed in Agriculture, Fishing & Hunting in Lansing, MI are:
What zip code has the Highest Percentage of Population Employed in Agriculture, Fishing & Hunting in Lansing, MI?
48912 has the Highest Percentage of Population Employed in Agriculture, Fishing & Hunting in Lansing, MI with 1.7%.
What is the Percentage of Population Employed in Agriculture, Fishing & Hunting in Lansing, MI?
Percentage of Population Employed in Agriculture, Fishing & Hunting in Lansing is 0.89%.
What is the Percentage of Population Employed in Agriculture, Fishing & Hunting in Michigan?
Percentage of Population Employed in Agriculture, Fishing & Hunting in Michigan is 0.98%.
What is the Percentage of Population Employed in Agriculture, Fishing & Hunting in the United States?
Percentage of Population Employed in Agriculture, Fishing & Hunting in the United States is 1.2%.