Zip Codes with the Highest Percentage of Population Employed in Agriculture, Fishing & Hunting in Jackson, MI
RELATED REPORTS & OPTIONS
Agriculture, Fishing & Hunting
Jackson
Compare Zip Codes
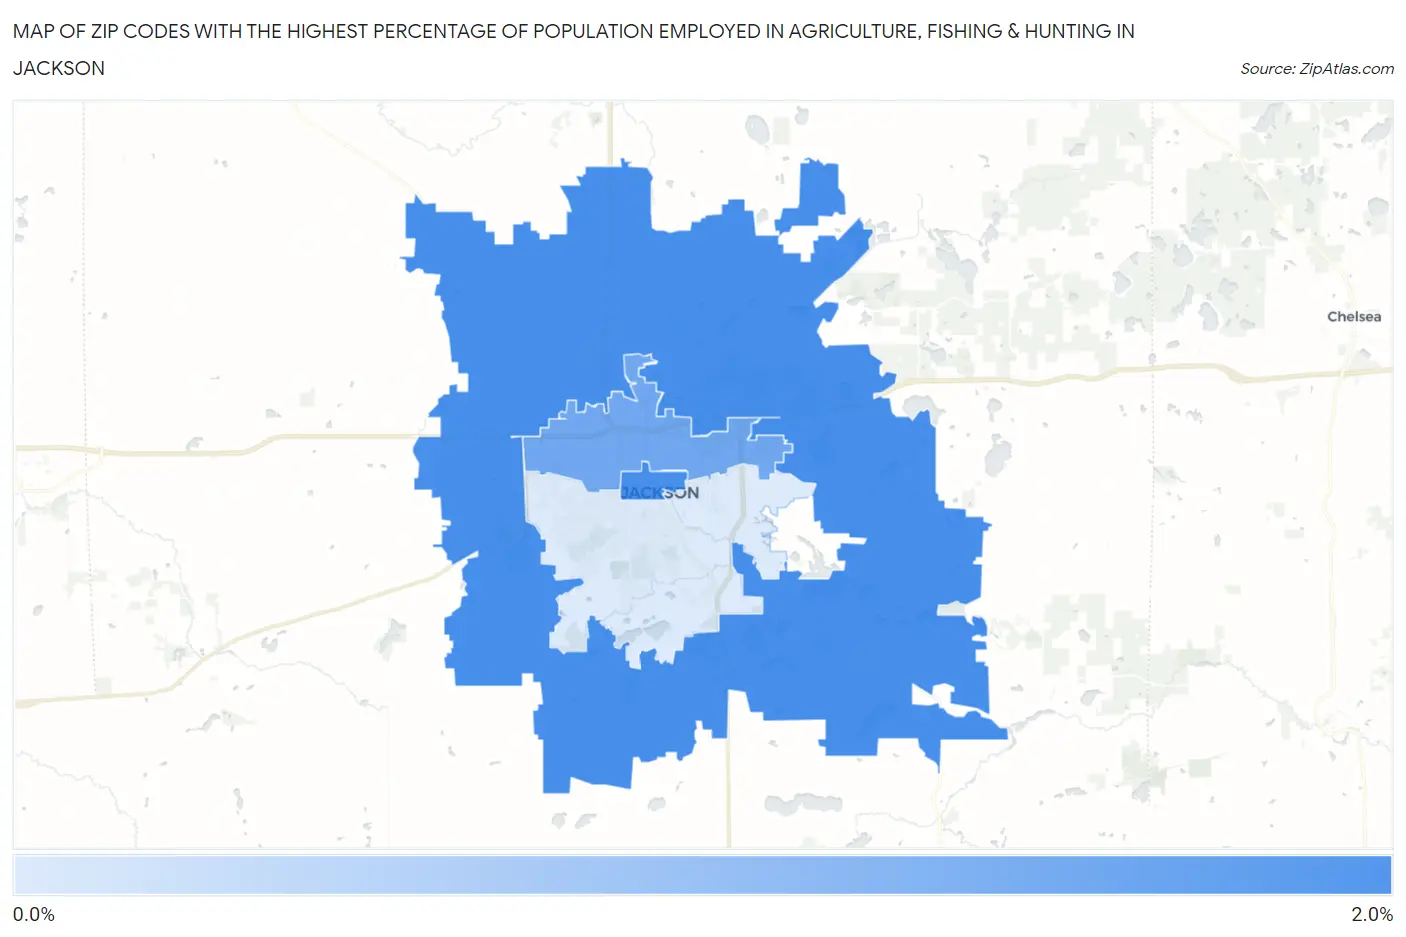
Map of Zip Codes with the Highest Percentage of Population Employed in Agriculture, Fishing & Hunting in Jackson
0.0%
2.0%
Zip Codes with the Highest Percentage of Population Employed in Agriculture, Fishing & Hunting in Jackson, MI
| Zip Code | % Employed | vs State | vs National | |
| 1. | 49201 | 1.7% | 0.98%(+0.680)#397 | 1.2%(+0.464)#13,762 |
| 2. | 49202 | 1.2% | 0.98%(+0.260)#467 | 1.2%(+0.045)#15,232 |
| 3. | 49203 | 0.14% | 0.98%(-0.841)#773 | 1.2%(-1.06)#23,116 |
1
Common Questions
What are the Top Zip Codes with the Highest Percentage of Population Employed in Agriculture, Fishing & Hunting in Jackson, MI?
Top Zip Codes with the Highest Percentage of Population Employed in Agriculture, Fishing & Hunting in Jackson, MI are:
What zip code has the Highest Percentage of Population Employed in Agriculture, Fishing & Hunting in Jackson, MI?
49201 has the Highest Percentage of Population Employed in Agriculture, Fishing & Hunting in Jackson, MI with 1.7%.
What is the Percentage of Population Employed in Agriculture, Fishing & Hunting in Jackson, MI?
Percentage of Population Employed in Agriculture, Fishing & Hunting in Jackson is 0.46%.
What is the Percentage of Population Employed in Agriculture, Fishing & Hunting in Michigan?
Percentage of Population Employed in Agriculture, Fishing & Hunting in Michigan is 0.98%.
What is the Percentage of Population Employed in Agriculture, Fishing & Hunting in the United States?
Percentage of Population Employed in Agriculture, Fishing & Hunting in the United States is 1.2%.