Zip Codes with the Highest Percentage of Renter-Occupied Units in Grand Rapids, MI
RELATED REPORTS & OPTIONS
Highest Renter-Occupied
Grand Rapids
Compare Zip Codes
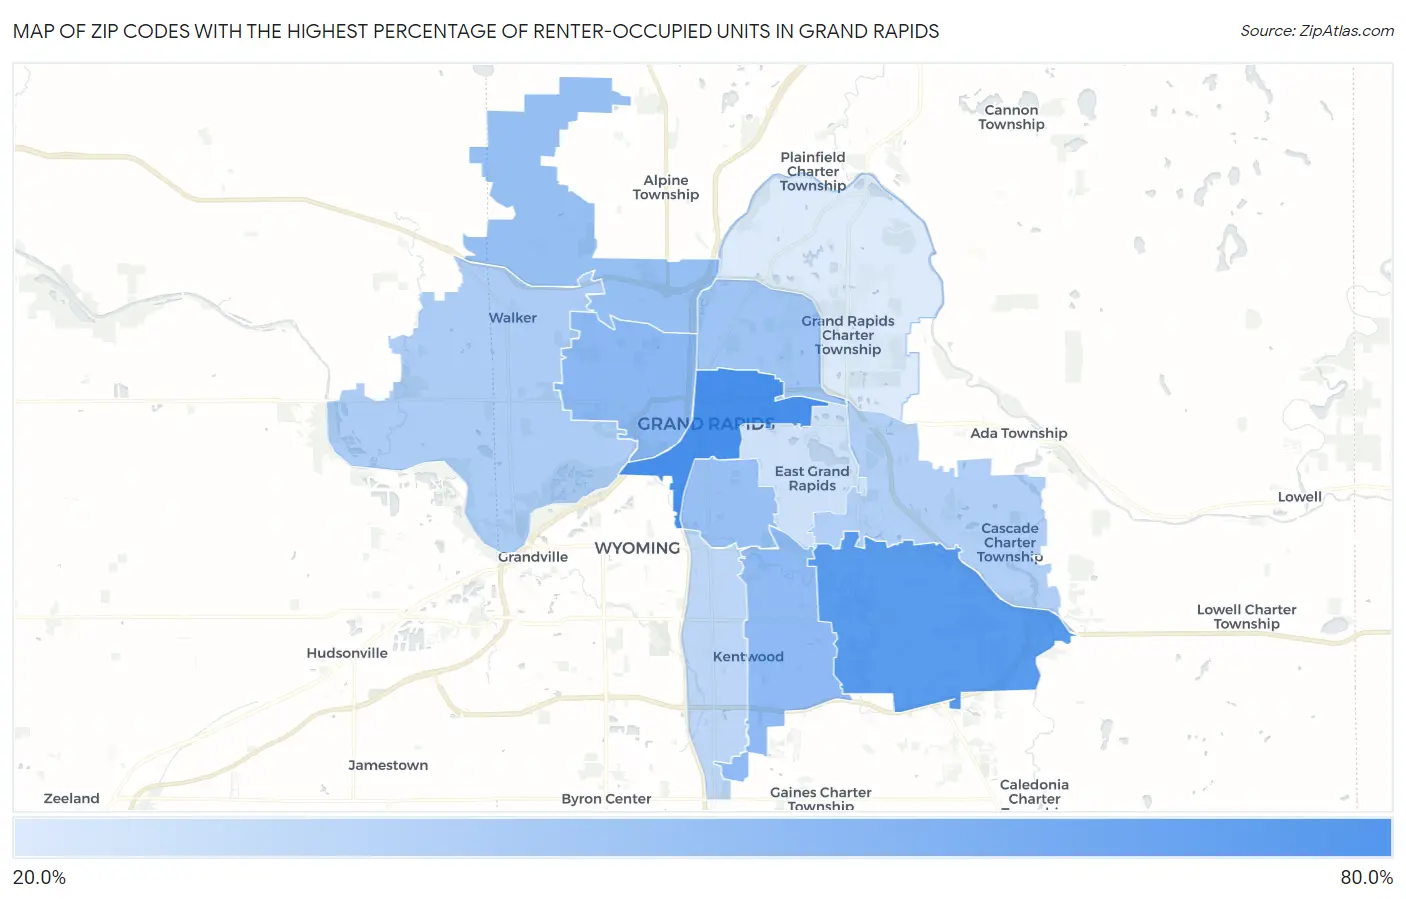
Map of Zip Codes with the Highest Percentage of Renter-Occupied Units in Grand Rapids
0.0%
80.0%
Zip Codes with the Highest Percentage of Renter-Occupied Units in Grand Rapids, MI
| Zip Code | % Renter-Occupied | vs State | vs National | |
| 1. | 49503 | 62.4% | 27.5%(+34.9)#22 | 35.2%(+27.2)#1,601 |
| 2. | 49512 | 57.0% | 27.5%(+29.5)#30 | 35.2%(+21.8)#2,110 |
| 3. | 49504 | 41.9% | 27.5%(+14.4)#80 | 35.2%(+6.76)#4,858 |
| 4. | 49508 | 40.9% | 27.5%(+13.4)#89 | 35.2%(+5.69)#5,153 |
| 5. | 49544 | 38.9% | 27.5%(+11.4)#101 | 35.2%(+3.70)#5,766 |
| 6. | 49507 | 38.5% | 27.5%(+11.0)#103 | 35.2%(+3.32)#5,903 |
| 7. | 49505 | 36.6% | 27.5%(+9.06)#114 | 35.2%(+1.38)#6,681 |
| 8. | 49534 | 32.5% | 27.5%(+4.99)#146 | 35.2%(-2.69)#8,588 |
| 9. | 49546 | 31.3% | 27.5%(+3.75)#158 | 35.2%(-3.93)#9,287 |
| 10. | 49548 | 28.5% | 27.5%(+0.966)#190 | 35.2%(-6.71)#11,062 |
| 11. | 49506 | 23.7% | 27.5%(-3.84)#264 | 35.2%(-11.5)#14,826 |
| 12. | 49525 | 20.6% | 27.5%(-6.96)#332 | 35.2%(-14.6)#17,690 |
1
Common Questions
What are the Top 10 Zip Codes with the Highest Percentage of Renter-Occupied Units in Grand Rapids, MI?
Top 10 Zip Codes with the Highest Percentage of Renter-Occupied Units in Grand Rapids, MI are:
What zip code has the Highest Percentage of Renter-Occupied Units in Grand Rapids, MI?
49503 has the Highest Percentage of Renter-Occupied Units in Grand Rapids, MI with 62.4%.
What is the Percentage of Renter-Occupied Units in Grand Rapids, MI?
Percentage of Renter-Occupied Units in Grand Rapids is 45.5%.
What is the Percentage of Renter-Occupied Units in Michigan?
Percentage of Renter-Occupied Units in Michigan is 27.5%.
What is the Percentage of Renter-Occupied Units in the United States?
Percentage of Renter-Occupied Units in the United States is 35.2%.