Zip Codes with the Oldest Population in East Lansing, MI
On this page
RELATED REPORTS & OPTIONS
Oldest Population
Population
Highest PopulationHighest Population DensityLowest Population DensityMale / Female RatioFemale / Male RatioOldest PopulationOldest Population | MaleOldest Population | FemaleYoungest PopulationYoungest Population | MaleYoungest Population | Female
Female Fertility
Highest Birth Rate | All WomenHighest Birth Rate | Public IncomeLowest Birth Rate | All WomenLowest Birth Rate | Public Income
Female Fertility (Unmarried)
Race (Community Size)
Race (Percentage)
Ancestry (Community Size)
AfghanAfricanAmericanArabArmenianAssyrian / Chaldean / SyriacAustralianAustrianBangladeshiBelgianBhutaneseBrazilianBritishBurmeseCanadianCentral AmericanCherokeeChippewaCosta RicanCroatianCubanCzechCzechoslovakianDanishDutchEastern EuropeanEcuadorianEnglishEthiopianEuropeanFilipinoFinnishFrenchFrench CanadianGermanGreekGuatemalanHungarianIndian (Asian)IranianIraqiIrishItalianKoreanLaotianLebaneseLithuanianMexicanMexican American IndianNigerianNorwegianOttawaPakistaniPeruvianPolishPortuguesePuerto RicanRomanianRussianScandinavianScotch-IrishScottishSerbianSlavicSlovakSloveneSouth AmericanSpaniardSri LankanSubsaharan AfricanSwedishSwissThaiUkrainianVenezuelanWelshWest Indian
Ancestry (Percentage)
AfghanAfricanAmericanArabArmenianAssyrian / Chaldean / SyriacAustralianAustrianBangladeshiBelgianBhutaneseBrazilianBritishBurmeseCanadianCentral AmericanCherokeeChippewaCosta RicanCroatianCubanCzechCzechoslovakianDanishDutchEastern EuropeanEcuadorianEnglishEthiopianEuropeanFilipinoFinnishFrenchFrench CanadianGermanGreekGuatemalanHungarianIndian (Asian)IranianIraqiIrishItalianKoreanLaotianLebaneseLithuanianMexicanMexican American IndianNigerianNorwegianOttawaPakistaniPeruvianPolishPortuguesePuerto RicanRomanianRussianScandinavianScotch-IrishScottishSerbianSlavicSlovakSloveneSouth AmericanSpaniardSri LankanSubsaharan AfricanSwedishSwissThaiUkrainianVenezuelanWelshWest Indian
Immigrant Origin (Total)
AfricaArgentinaAsiaBangladeshBrazilCanadaCaribbeanCentral AmericaChinaDenmarkDominican RepublicEastern AsiaEastern EuropeEnglandEuropeHong KongIndiaJapanKoreaLatin AmericaMexicoNepalNigeriaNorthern EuropeNorwayOceaniaPakistanRomaniaSouth AmericaSouth Central AsiaWestern AfricaWestern Asia
Immigrant Origin (Percentage)
AfricaArgentinaAsiaBangladeshBrazilCanadaCaribbeanCentral AmericaChinaDenmarkDominican RepublicEastern AsiaEastern EuropeEnglandEuropeHong KongIndiaJapanKoreaLatin AmericaMexicoNepalNigeriaNorthern EuropeNorwayOceaniaPakistanRomaniaSouth AmericaSouth Central AsiaWestern AfricaWestern Asia
Income
Highest Per Capita IncomeHighest Earnings | MaleHighest Earnings | FemaleHighest Wage/Income Gap ($)Highest Wage/Income Gap (%)Lowest Per Capita IncomeLowest Earnings | MaleLowest Earnings | FemaleLowest Wage/Income Gap ($)Lowest Wage/Income Gap (%)
Unemployment
Highest UnemploymentHighest Unemployment | MaleHighest Unemployment | FemaleHighest Unemployment | Youth < 25Lowest UnemploymentLowest Unemployment | MaleLowest Unemployment | FemaleLowest Unemployment | Youth < 25
Employment Occupations
Architecture & EngineeringArts, Media & EntertainmentBusiness & FinancialCleaning & MaintenanceCommunity & Social Service Computer & MathematicsComputer, Engineering & ScienceConstruction & ExtractionEducation Instruction & LibraryEducation, Arts & MediaFarming, Fishing & ForestryFirefighting & PreventionFood Preparation & ServingHealth Diagnosing & TreatingHealthcare SupportInstallation, Maintenance & RepairLife, Physical & Social ScienceManagementMaterial MovingOffice & AdministrationPersonal Care and ServiceProductionSales & RelatedSecurity & ProtectionTransportation
Employment Industries
Accommodation & Food ServicesAdministrative & Support ServicesAgriculture, Fishing & HuntingArts, Entertainment & RecreationConstructionEducational ServicesFinance & InsuranceHealth Care & Social AssistanceInformation & TechnologyManufacturingProfessional & Scientific ServicesPublic AdministrationReal Estate, Rental & LeasingRetail TradeTransportation & WarehousingWholesale Trade
Employer Class
Private Company EmployeesSelf-Employed / IncorporatedSelf-Employed / Not IncorporatedNot-for-profit OrganizationsLocal Government EmployeesState Government EmployeesFederal Government Employees
Commute Time
Longest CommuteLongest Commute | MaleLongest Commute | FemaleShortest CommuteShortest Commute | MaleShortest Commute | Female
Commute Means
School Enrollment
Education by Degree Field
East Lansing
States
AlabamaAlaskaArizonaArkansasCaliforniaColoradoConnecticutDelawareDistrict Of ColumbiaFloridaGeorgiaHawaiiIdahoIllinoisIndianaIowaKansasKentuckyLouisianaMaineMarylandMassachusettsMichiganMinnesotaMississippiMissouriMontanaNebraskaNevadaNew HampshireNew JerseyNew MexicoNew YorkNorth CarolinaNorth DakotaOhioOklahomaOregonPennsylvaniaPuerto RicoRhode IslandSouth CarolinaSouth DakotaTennesseeTexasUtahVermontVirginiaWashingtonWest VirginiaWisconsinWyoming
Michigan Cities
Ann ArborBattle CreekBay CityBerrien SpringsBloomfield HillsBrightonBurtonCantonClarkstonClinton TownshipDearbornDearborn HeightsDetroitEast LansingFarmingtonFlintGrand RapidsGrosse PointeHighlandHollandHowellJacksonKalamazooKincheloeLake OrionLansingLivoniaMacombMidlandMilfordMonroeMount PleasantMuskegonNew BaltimoreNew HavenNorthvilleNoviOxfordPontiacPortageRedfordRochesterRoyal OakSaginawSaint Clair ShoresSouthfieldSterling HeightsTraverse CityTroyUticaWarrenWashingtonWaterfordWest BloomfieldWestlandWhite LakeWyomingYpsilanti
Compare Zip Codes
Comparison Subject
Compare StatesCompare CitiesCompare Zip Codes
Map of Zip Codes with the Oldest Population in East Lansing
19.1
24.5
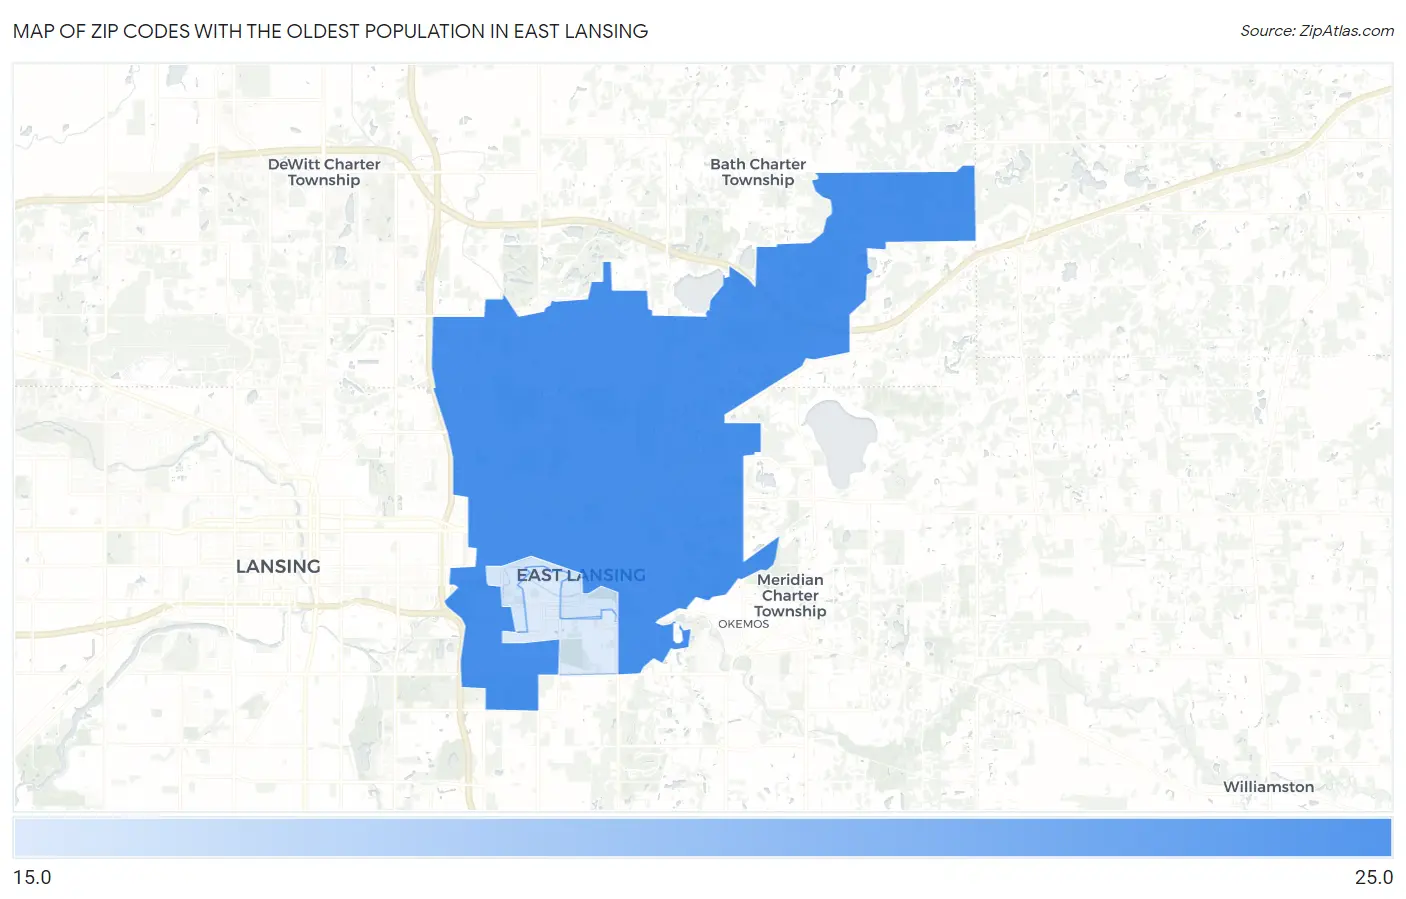
Zip Codes with the Oldest Population in East Lansing, MI
| Zip Code | Median Age | vs State | vs National | |
| 1. | 48823 | 24.5 | 39.9(-15.4)#971 | 38.5(-14.0)#31,903 |
| 2. | 48825 | 19.4 | 39.9(-20.5)#980 | 38.5(-19.1)#32,611 |
| 3. | 48824 | 19.1 | 39.9(-20.8)#982 | 38.5(-19.4)#32,679 |
1
Common Questions
What are the Top Zip Codes with the Oldest Population in East Lansing, MI?
Top Zip Codes with the Oldest Population in East Lansing, MI are:
What zip code has the Oldest Population in East Lansing, MI?
48823 has the Oldest Population in East Lansing, MI with 24.5.
What is the Median Age in East Lansing, MI?
Median Age in East Lansing is 21.4.
What is the Median Age in Michigan?
Median Age in Michigan is 39.9.
What is the Median Age in the United States?
Median Age in the United States is 38.5.