Zip Codes with the Highest Poverty Level in Detroit, MI

RELATED REPORTS & OPTIONS

Highest Poverty
Population
Families and Households
Female Fertility
Female Fertility (Unmarried)
Race (Community Size)
Race (Percentage)
Ancestry (Community Size)
AfricanAlbanianAmericanApacheArabArgentineanArmenianAssyrian / Chaldean / SyriacAustralianAustrianBahamianBangladeshiBarbadianBelgianBelizeanBermudanBhutaneseBlackfeetBrazilianBritishBritish West IndianBurmeseCanadianCentral AmericanCentral American IndianCherokeeChippewaChoctawColombianCosta RicanCreekCroatianCubanCzechCzechoslovakianDanishDominicanDutchEastern EuropeanEcuadorianEgyptianEnglishEthiopianEuropeanFilipinoFinnishFrenchFrench American IndianFrench CanadianGermanGhanaianGreekGuamanian / ChamorroGuatemalanHaitianHonduranHungarianIndian (Asian)IndonesianIranianIraqiIrishIroquoisIsraeliItalianJamaicanJapaneseJordanianKoreanLebaneseLiberianLithuanianLumbeeMacedonianMalteseMexicanMexican American IndianMoroccanNative HawaiianNavajoNew ZealanderNicaraguanNigerianNorthern EuropeanNorwegianOttawaPakistaniPalestinianPanamanianPennsylvania GermanPeruvianPolishPortuguesePotawatomiPuerto RicanRomanianRussianSalvadoranSamoanScandinavianScotch-IrishScottishSenegaleseSerbianSlavicSlovakSloveneSouth AfricanSouth AmericanSouth American IndianSpaniardSpanishSri LankanSubsaharan AfricanSudaneseSwedishSwissSyrianThaiTrinidadian and TobagonianTurkishUkrainianVenezuelanVietnameseWelshWest IndianYugoslavian
Ancestry (Percentage)
AfricanAlbanianAmericanApacheArabArgentineanArmenianAssyrian / Chaldean / SyriacAustralianAustrianBahamianBangladeshiBarbadianBelgianBelizeanBermudanBhutaneseBlackfeetBrazilianBritishBritish West IndianBurmeseCanadianCentral AmericanCentral American IndianCherokeeChippewaChoctawColombianCosta RicanCreekCroatianCubanCzechCzechoslovakianDanishDominicanDutchEastern EuropeanEcuadorianEgyptianEnglishEthiopianEuropeanFilipinoFinnishFrenchFrench American IndianFrench CanadianGermanGhanaianGreekGuamanian / ChamorroGuatemalanHaitianHonduranHungarianIndian (Asian)IndonesianIranianIraqiIrishIroquoisIsraeliItalianJamaicanJapaneseJordanianKoreanLebaneseLiberianLithuanianLumbeeMacedonianMalteseMexicanMexican American IndianMoroccanNative HawaiianNavajoNew ZealanderNicaraguanNigerianNorthern EuropeanNorwegianOttawaPakistaniPalestinianPanamanianPennsylvania GermanPeruvianPolishPortuguesePotawatomiPuerto RicanRomanianRussianSalvadoranSamoanScandinavianScotch-IrishScottishSenegaleseSerbianSlavicSlovakSloveneSouth AfricanSouth AmericanSouth American IndianSpaniardSpanishSri LankanSubsaharan AfricanSudaneseSwedishSwissSyrianThaiTrinidadian and TobagonianTurkishUkrainianVenezuelanVietnameseWelshWest IndianYugoslavian
Immigrant Origin (Total)
Immigrant Origin (Percentage)
Income
Income (Families)
Income (Households)
Poverty
Poverty (Families)
Unemployment
Employment Occupations
Employment Industries
Employer Class
Commute Time
Commute Means
School Enrollment
Education by Degree Field
Occupancy
Finances
Physical Characteristics
Detroit
Compare Zip Codes
Comparison Subject

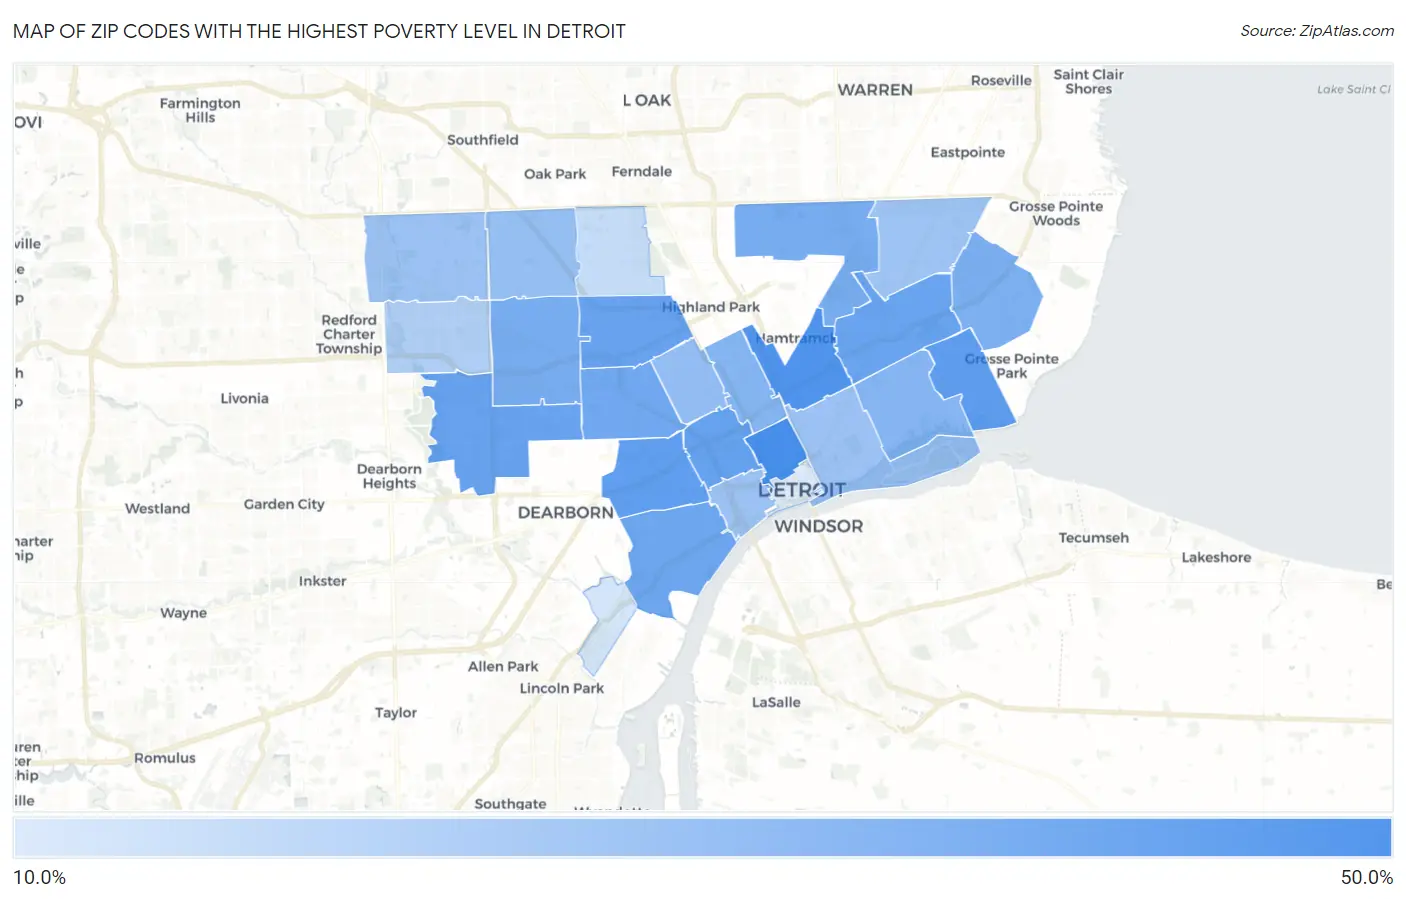
Map of Zip Codes with the Highest Poverty Level in Detroit

0.0%
50.0%
Zip Codes with the Highest Poverty Level in Detroit Map

Zip Codes with the Highest Poverty Level in Detroit, MI

Zip Code Poverty vs State vs National
1.4820144.8%13.1%(+31.6)#612.5%(+32.2)#803
2.4821142.9%13.1%(+29.8)#912.5%(+30.4)#890
3.4821539.9%13.1%(+26.8)#1412.5%(+27.4)#1,075
4.4821039.2%13.1%(+26.0)#1512.5%(+26.6)#1,134
5.4820838.2%13.1%(+25.1)#1812.5%(+25.7)#1,200
6.4823837.8%13.1%(+24.7)#1912.5%(+25.3)#1,235
7.4822837.6%13.1%(+24.5)#2012.5%(+25.1)#1,254
8.4821337.0%13.1%(+23.8)#2112.5%(+24.4)#1,310
9.4820936.4%13.1%(+23.2)#2212.5%(+23.8)#1,378
10.4820435.8%13.1%(+22.7)#2412.5%(+23.3)#1,443
11.4823434.4%13.1%(+21.2)#2912.5%(+21.8)#1,622
12.4822734.2%13.1%(+21.0)#3512.5%(+21.6)#1,654
13.4822433.3%13.1%(+20.2)#3912.5%(+20.8)#1,772
14.4820231.5%13.1%(+18.3)#5112.5%(+18.9)#2,103
15.4821431.4%13.1%(+18.2)#5212.5%(+18.8)#2,122
16.4820628.4%13.1%(+15.3)#6612.5%(+15.9)#2,702
17.4823528.1%13.1%(+15.0)#6812.5%(+15.6)#2,772
18.4821627.3%13.1%(+14.2)#7012.5%(+14.8)#2,973
19.4820726.7%13.1%(+13.6)#7412.5%(+14.2)#3,128
20.4821926.7%13.1%(+13.5)#7512.5%(+14.1)#3,132
21.4820526.4%13.1%(+13.3)#7712.5%(+13.9)#3,201
22.4822322.6%13.1%(+9.50)#10012.5%(+10.1)#4,576
23.4822118.8%13.1%(+5.69)#15912.5%(+6.29)#6,919
24.4821716.4%13.1%(+3.29)#22112.5%(+3.89)#8,922
25.4822614.6%13.1%(+1.42)#29612.5%(+2.02)#10,952

Common Questions

What are the Top 10 Zip Codes with the Highest Poverty Level in Detroit, MI?
Top 10 Zip Codes with the Highest Poverty Level in Detroit, MI are:
#1
44.8%
#2
42.9%
#3
39.9%
#4
39.2%
#5
38.2%
#6
37.8%
#7
37.6%
#8
37.0%
#9
36.4%
#10
35.8%
What zip code has the Highest Poverty Level in Detroit, MI?
48201 has the Highest Poverty Level in Detroit, MI with 44.8%.
What is the Poverty Level in Detroit, MI?
Poverty Level in Detroit is 31.5%.
What is the Poverty Level in Michigan?
Poverty Level in Michigan is 13.1%.
What is the Poverty Level in the United States?
Poverty Level in the United States is 12.5%.