Zip Codes with the Highest Percentage of Population Employed in Agriculture, Fishing & Hunting in Dearborn, MI
RELATED REPORTS & OPTIONS
Agriculture, Fishing & Hunting
Dearborn
Compare Zip Codes
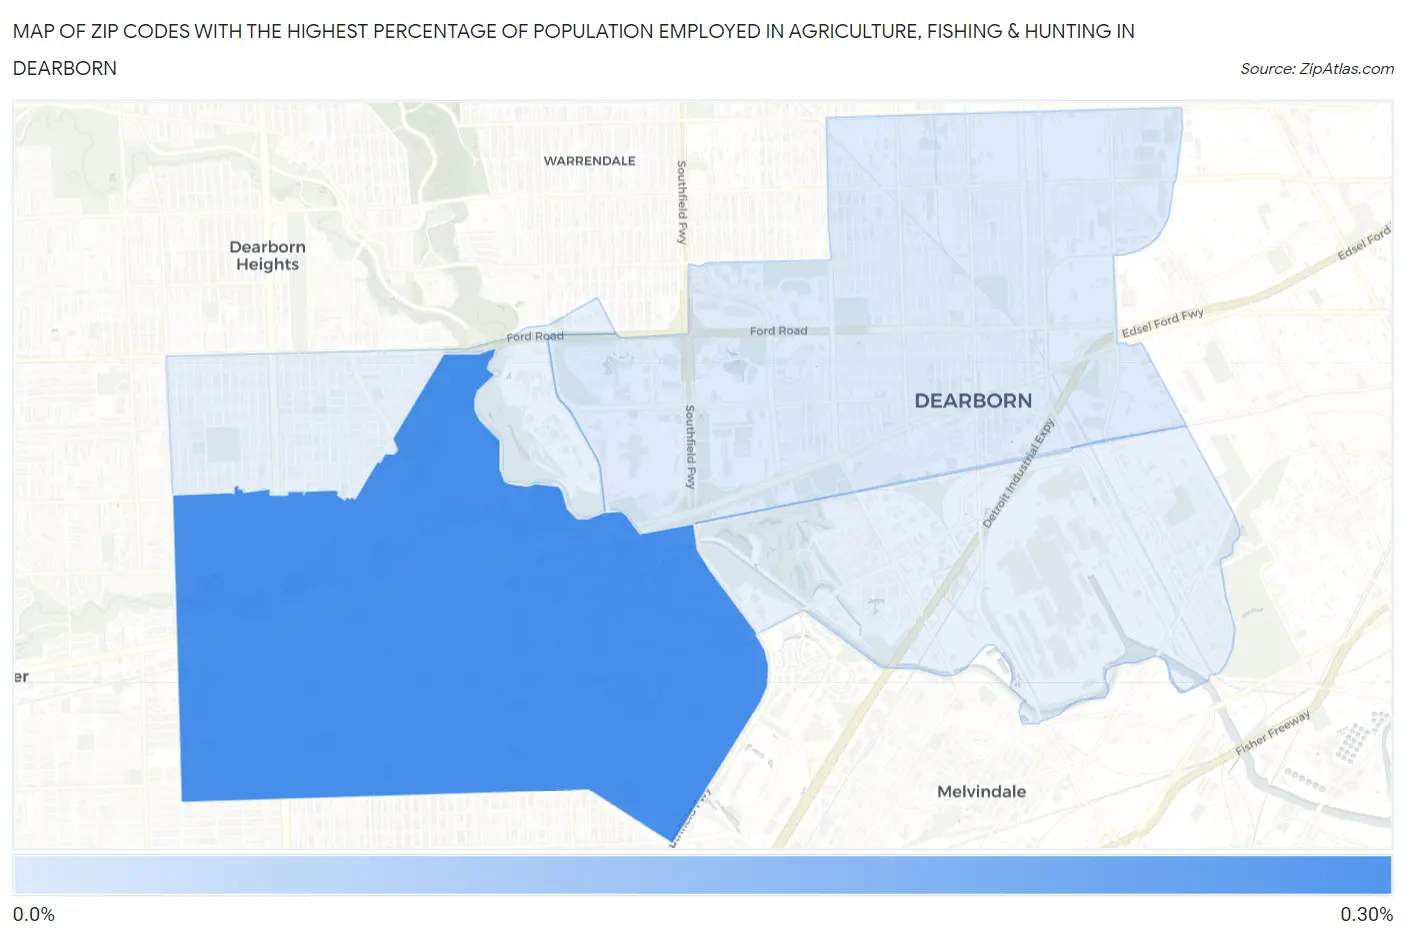
Map of Zip Codes with the Highest Percentage of Population Employed in Agriculture, Fishing & Hunting in Dearborn
0.0%
0.30%
Zip Codes with the Highest Percentage of Population Employed in Agriculture, Fishing & Hunting in Dearborn, MI
| Zip Code | % Employed | vs State | vs National | |
| 1. | 48124 | 0.25% | 0.98%(-0.732)#726 | 1.2%(-0.947)#21,733 |
| 2. | 48126 | 0.056% | 0.98%(-0.928)#810 | 1.2%(-1.14)#24,275 |
1
Common Questions
What are the Top 3 Zip Codes with the Highest Percentage of Population Employed in Agriculture, Fishing & Hunting in Dearborn, MI?
Top 3 Zip Codes with the Highest Percentage of Population Employed in Agriculture, Fishing & Hunting in Dearborn, MI are:
What zip code has the Highest Percentage of Population Employed in Agriculture, Fishing & Hunting in Dearborn, MI?
48124 has the Highest Percentage of Population Employed in Agriculture, Fishing & Hunting in Dearborn, MI with 0.25%.
What is the Percentage of Population Employed in Agriculture, Fishing & Hunting in Dearborn, MI?
Percentage of Population Employed in Agriculture, Fishing & Hunting in Dearborn is 0.12%.
What is the Percentage of Population Employed in Agriculture, Fishing & Hunting in Michigan?
Percentage of Population Employed in Agriculture, Fishing & Hunting in Michigan is 0.98%.
What is the Percentage of Population Employed in Agriculture, Fishing & Hunting in the United States?
Percentage of Population Employed in Agriculture, Fishing & Hunting in the United States is 1.2%.