Zip Codes with the Highest Percentage of Population Employed in Farming, Fishing & Forestry in Dearborn, MI
RELATED REPORTS & OPTIONS
Farming, Fishing & Forestry
Dearborn
Compare Zip Codes
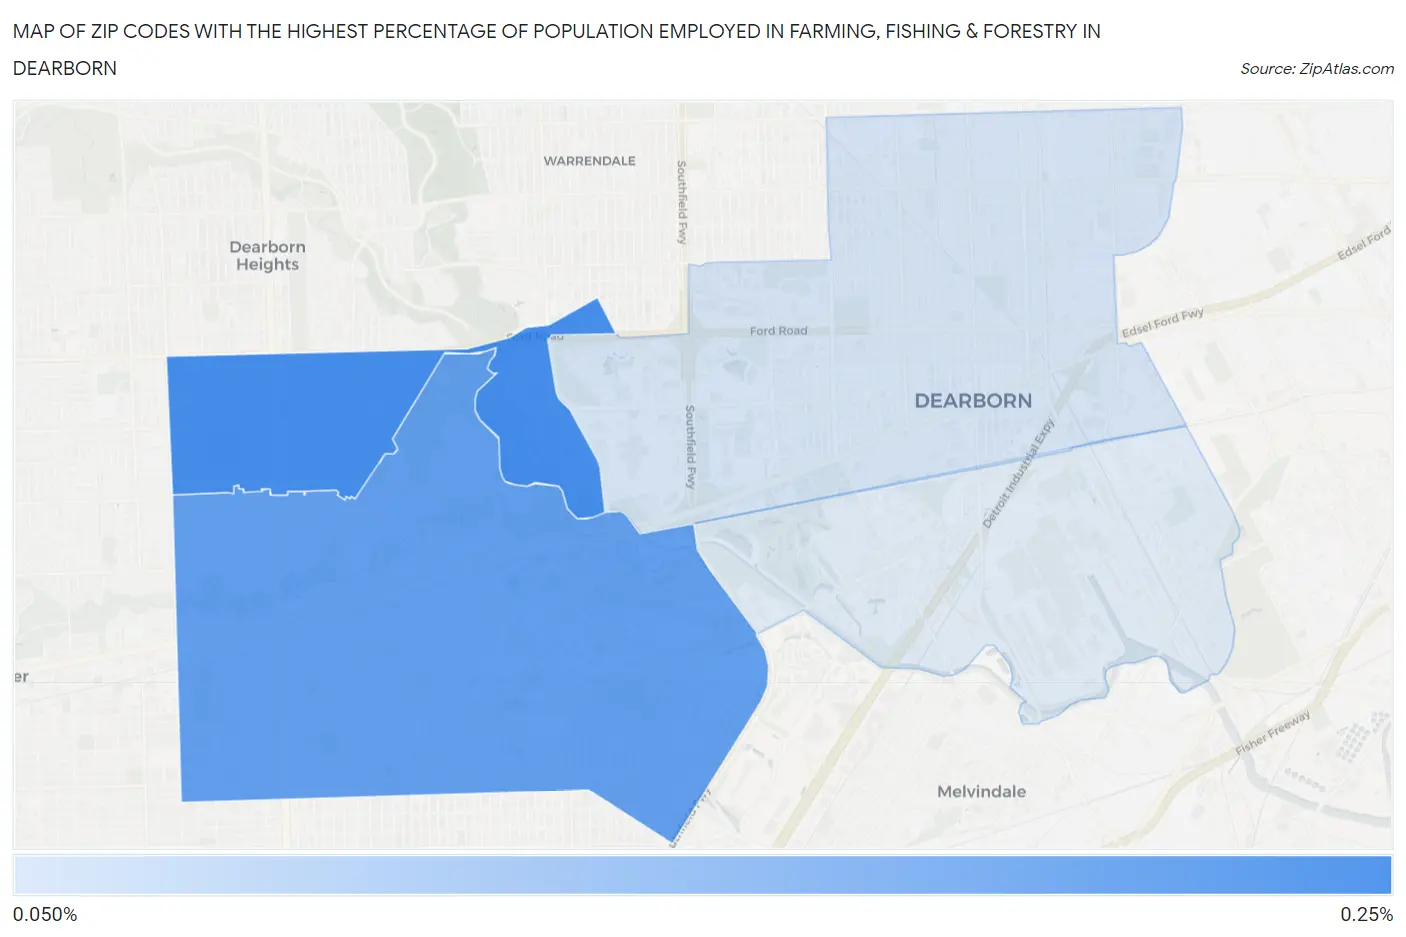
Map of Zip Codes with the Highest Percentage of Population Employed in Farming, Fishing & Forestry in Dearborn
0.0%
0.25%
Zip Codes with the Highest Percentage of Population Employed in Farming, Fishing & Forestry in Dearborn, MI
| Zip Code | % Employed | vs State | vs National | |
| 1. | 48128 | 0.23% | 0.47%(-0.236)#544 | 0.61%(-0.375)#15,681 |
| 2. | 48124 | 0.20% | 0.47%(-0.271)#570 | 0.61%(-0.410)#16,194 |
| 3. | 48126 | 0.056% | 0.47%(-0.411)#665 | 0.61%(-0.550)#18,552 |
1
Common Questions
What are the Top 3 Zip Codes with the Highest Percentage of Population Employed in Farming, Fishing & Forestry in Dearborn, MI?
Top 3 Zip Codes with the Highest Percentage of Population Employed in Farming, Fishing & Forestry in Dearborn, MI are:
What zip code has the Highest Percentage of Population Employed in Farming, Fishing & Forestry in Dearborn, MI?
48128 has the Highest Percentage of Population Employed in Farming, Fishing & Forestry in Dearborn, MI with 0.23%.
What is the Percentage of Population Employed in Farming, Fishing & Forestry in Dearborn, MI?
Percentage of Population Employed in Farming, Fishing & Forestry in Dearborn is 0.13%.
What is the Percentage of Population Employed in Farming, Fishing & Forestry in Michigan?
Percentage of Population Employed in Farming, Fishing & Forestry in Michigan is 0.47%.
What is the Percentage of Population Employed in Farming, Fishing & Forestry in the United States?
Percentage of Population Employed in Farming, Fishing & Forestry in the United States is 0.61%.